Citizens Science solution based on synergy of different Nairobi INSPIRE Hack Pilots

This is a joint progress report of teams no. 1, 5, 6 and 8 of the Nairobi INSPIRE Hackathon 2019.

Effective environmental management – including day-to-day, hazard and crisis management – is dependent on effective environmental monitoring. But monitoring over large areas in-situ often requires higher levels of capacity than monitoring bodies have. At the same time, those measurements that we can get over large areas – the Earth Observation data coming from satellites – may need in-situ validation in order to provide sufficiently predictive models for meaningful management. Again this can require very high levels of capacity. In both cases, Citizen Science (CS) has already emerged as a potential solution, as exemplified by projects such as beAWARE, Ground Truth 2.0, and a whole range of innovation initiatives – including INSPIRE’s hackathons.

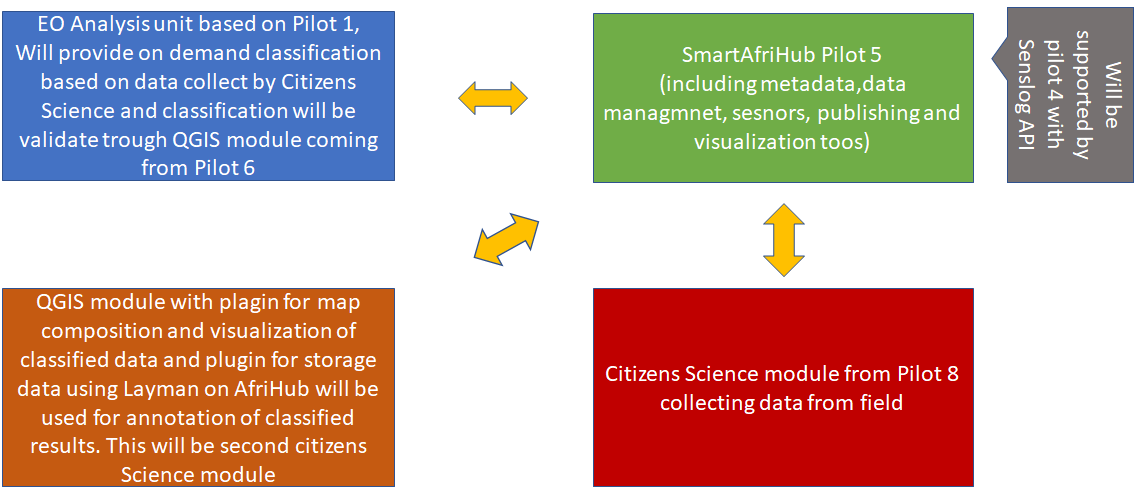
Nairobi INSPIRE Hack is trying to bring new quality and aspects into Citizen Science (CS), extended current understanding of CS and ensuring that CS data can be  interoperable with other systems and data relevant to Environmental and Spatial Data Infrastructure applications. From existing teams, which tested some concepts during Nairobi INSPIRE Hackathon team, we design more complex and open solution, which will support better utilisation of CS potential. We defined basic scheme, which can be base for future complex CSsolution.

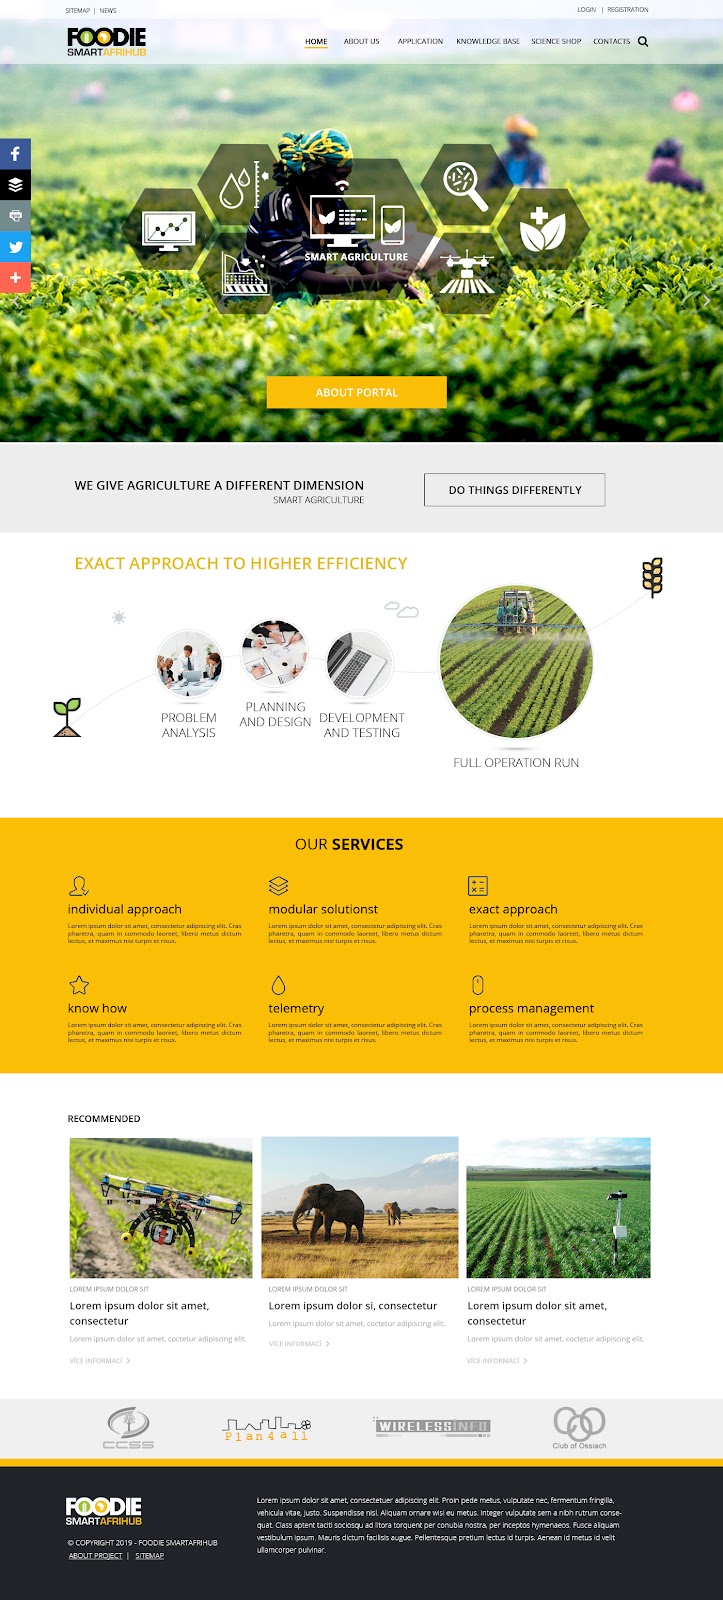
Core component will be Digital Innovation Hub (DIH) SmartAfriHub. Digital Innovation Hubs (DIHs) ensure the connection between the ICT and the communities by bringing together IT suppliers, the users as foresters and farming sector, technology experts, investors and other relevant actors. This leads to new applications that are adapted to the real needs of communities. The intention of Nairobi INSPIRE Hack is to develop a social space for African agriculture and forestry, where farmers, forest owners, the industry, research community, advisory services and others will be able share their knowledge, needs and experience.

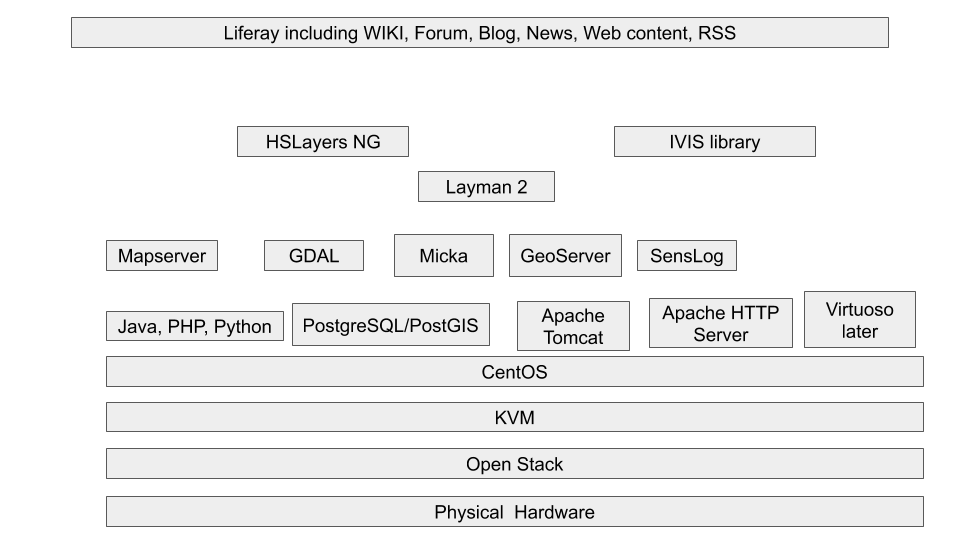
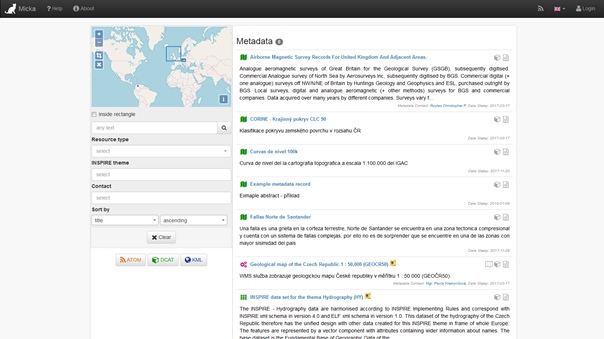
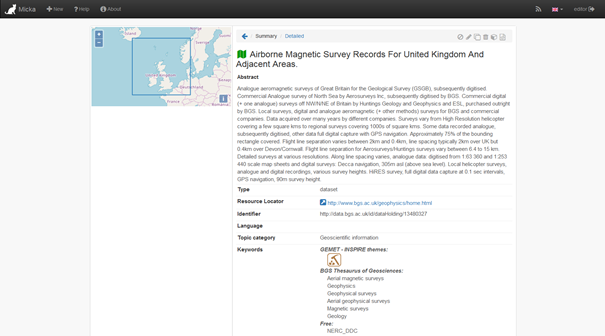
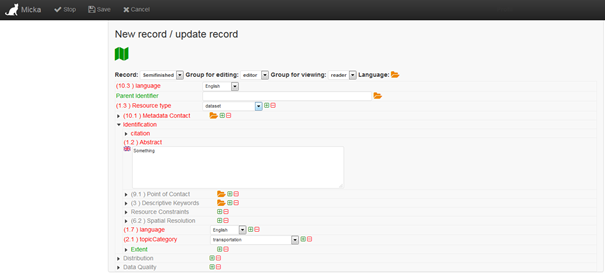
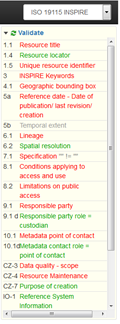
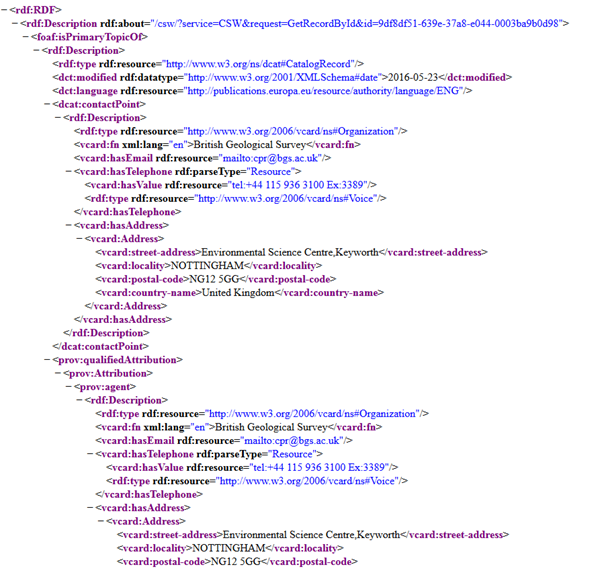
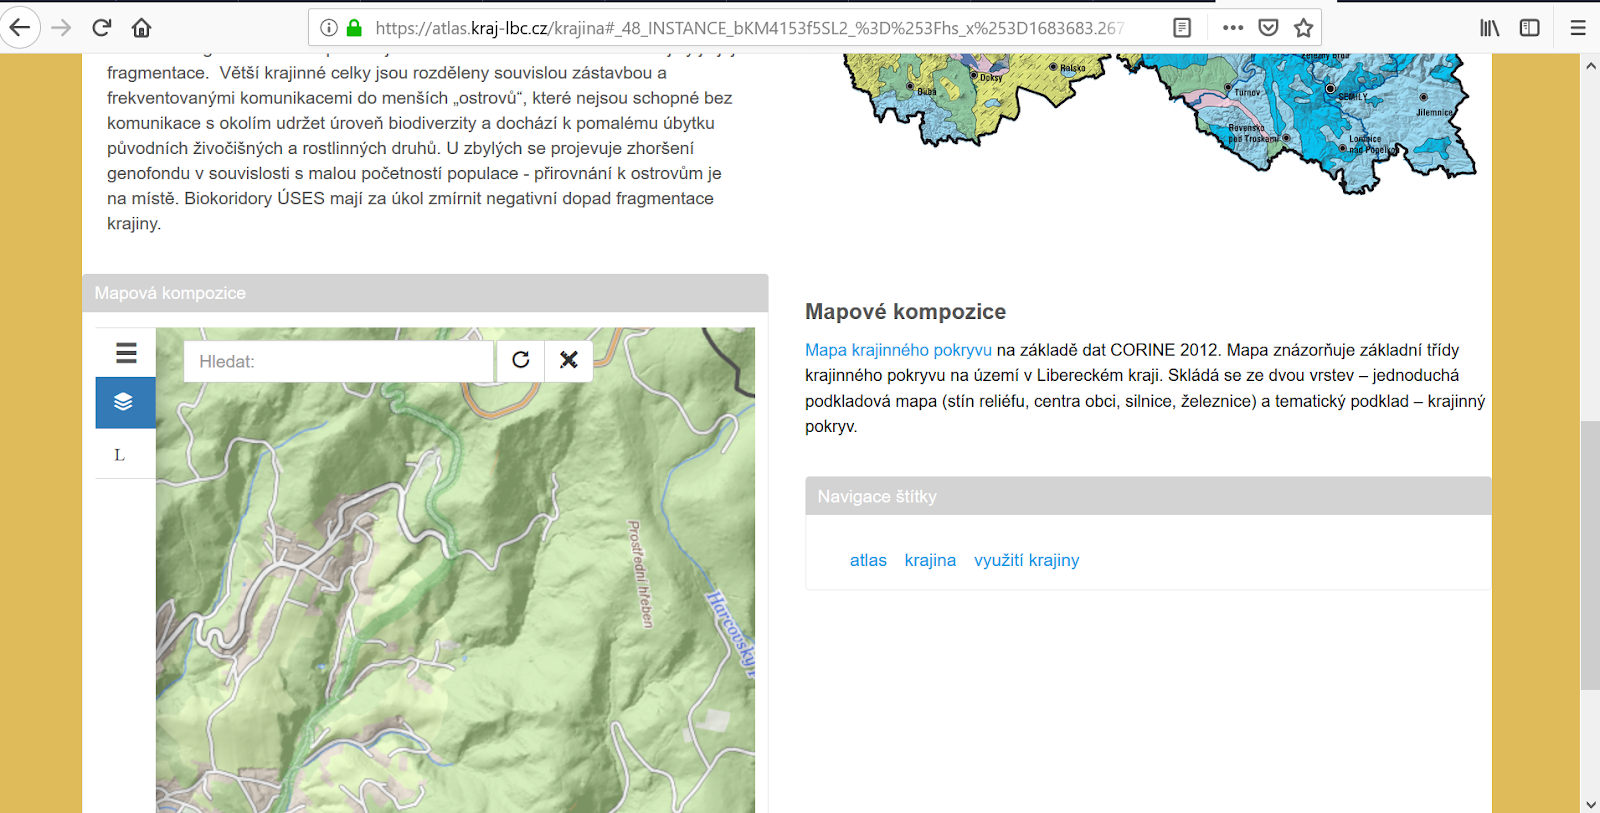
From the scheme is visible, that SmartAfriHub is focused not only on sharing documents, but main focus is on sharing different spatial information.  Important part of all infrastructure is Geospatial Catalogue Micka (see progress report focused  on this aspects). This catalogue supports harvesting metadata for spatial data and services from different existing sources like FAO, GEOSS etc and builds one access point for all communities to this services. Micka is using common standards, but there is one important extension, which can introduce a new concept of Citizen Science. This is Map Composition.

Map Composition and Citizen Science objects

Today we propose to you the idea that “maps” are interesting not only as visualizations of Citizen Science  data capturing through semi-voluntary projects — but as shareable, fascinating and valuable Citizen Science objects in themselves.

Citizen Science has until now been very much about trying to structure data from Internet users into harmonized (or semi-harmonized) data sets such as the hugely successful Open Street Map and the like. Users contribute points, lines and polygons as well as their meaning. Similarly, services like Instagram capture image data and exposes it through APIs for use in a multitude of serendipitous, and not so serendipitous ways.

So why do we believe that the “map” is an object that people would like to share — and why do we believe that it proves added value to people’s lives?

  • All of us have tried to explain a location to someone over the phone
  • All of us have asked for advice from well-meaning but “spatially challenged” staff in hotel receptions
  • All of us have tried to discuss what we believe to be the same location with a colleague over the phone
  • Some of us have tried to explain a colleague how to add a WMS theme to an interactive map client

All of us, at one stage or another, without exception have failed at these tasks. Some times miserably.

This is where the “map” comes to play. Once, a map used to be an expensive rolled up scroll of calves skin that was drawn by a skilled artist from the manuscripts of daring sea-farers in the great age of discovery. Later, maps were produced by less picturesque but more efficient means – until the advent of the GIS age when a lot of people who previously couldn’t suddenly could make professional LOOKING maps.

Nowadays, a map is not a “flat image” but a complex layered object that references data sources ‘scattered’ across a decentralized, democratic and at times volatile Internet.

Our needs are many — and very different — but so are our skill sets; thus offering everyone sophisticated GIS tools capable of making their own maps is not a likely path to ‘happy forever after’. It is often simpler, better and more effective to simply give them a “map”.

There currently exists hundreds of services offering spatial information through real-time interactive protocols such as WMS and WFS etc. Soon, if member states and signatories to INSPIRE do as they are legally obliged, this number will be thousands — ten thousands.

The fact that a map is a composite object referring to a lot of live data sources around the net, require the existence of a “Map Composition” standard that describes the elements that constitute a map and how they should be combined to fit together neatly.

An early effort by the OGC was the Web Map Context specification that has not evolved since 2005. This little bit ‘heavyweight’ XML-based standard is limited in scope and has not evolved with the developments in standards and technology in the 11 years that have passed since its creation.

Recently the three European Community funded projects SDI4Apps, Foodie and OTN have started the work of defining a simple, lightweight specification for Map Compositions using HTML5- and bandwidth friendly JavaScript Object Notation (JSON) as a carrier of information.

The current specification of the JSON Map Composition is available on the GitHub Wiki of HSLayers NG. We believe Map Compositions have a wide range of private and professional use cases and would like to use the Nairobi INSPIRE Hack to extend this concept. To ensure that Map Compositions play a positive role in the future of spatial data, we we need to establish through examples and trials how they:

  • provide societal and/or economic benefit
  • serve existing, current or foreseeable needs
  • fit into existing processes
  • replaces existing processes

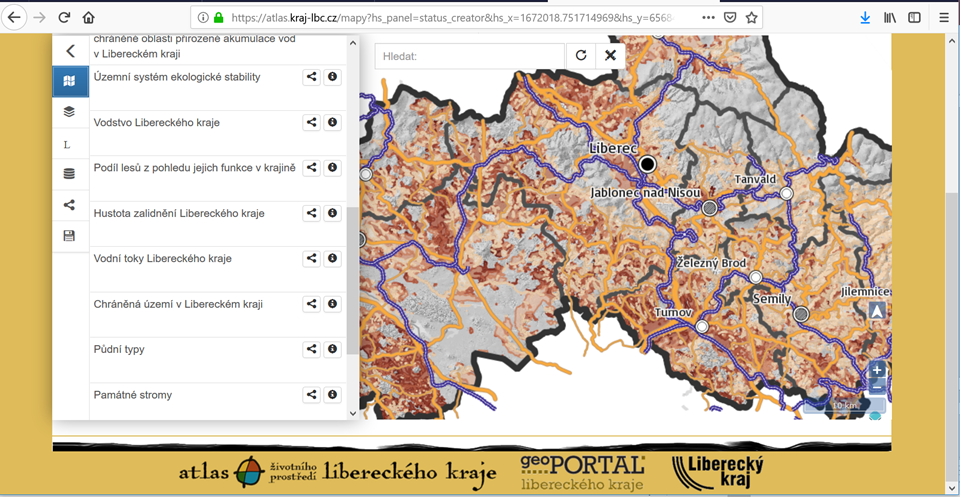
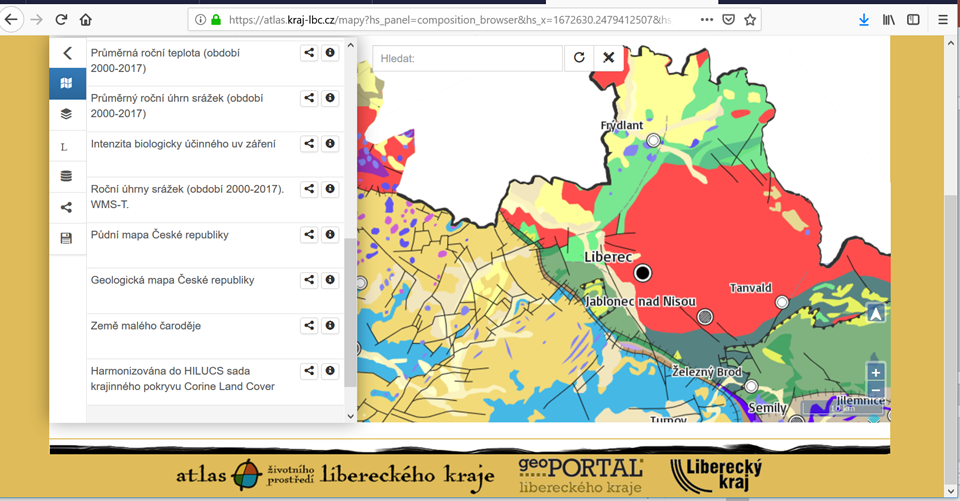
Current solution allow not only search for Map composition on Hub, but for example also share this composition through Social Media.

or embed this compositions into Web pages as interactive maps

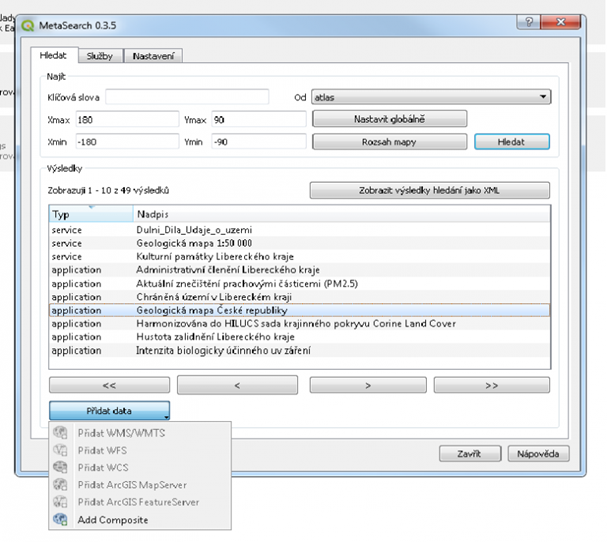
Metasearch plugin for QGIS

Metasearch plugin extends function of QGIS about loading Map compositions from innovation Hub using standard CSW. It is opening possibilities for validation existing data, results of classification and other services on DIH on desktops and allows better utilisation of existing data.

Data on DiH

Search for existing data and services on DiH from QGIS

and then open map composition on QGIS

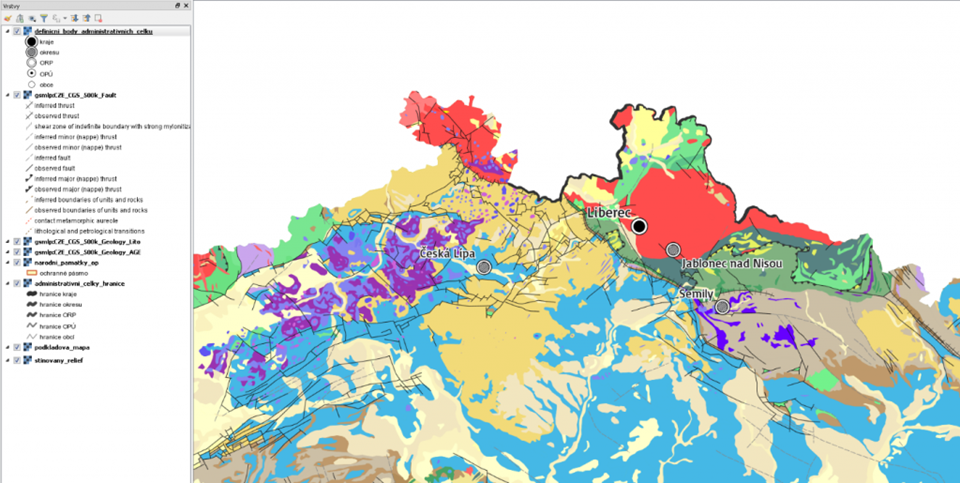
Next step, which is now under development is storing new maps and components on DiH directly from QGIS. This will be realised through Layman component of DiH.

This will bring new methods into citizens science and will support better interaction with DiH. It will help annotate existing classification, but also prepare training samples for classification of Earth Observation Data.

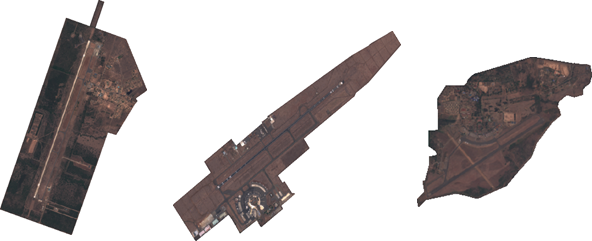
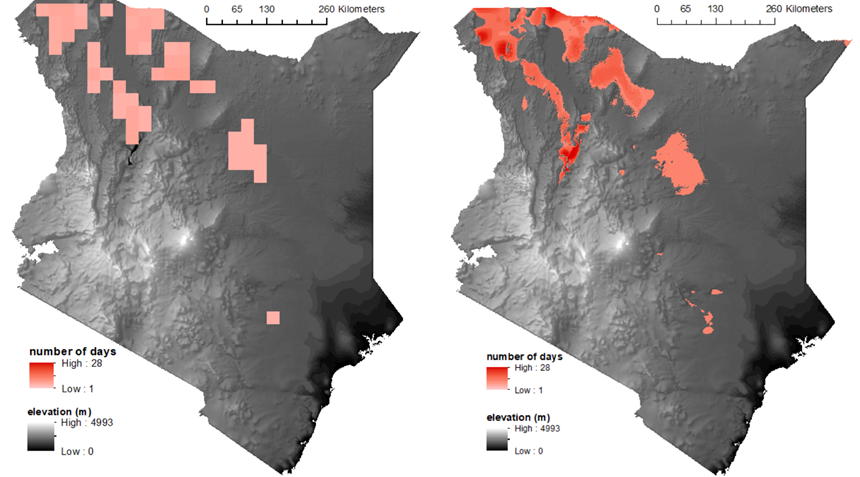
Earth Observation Module

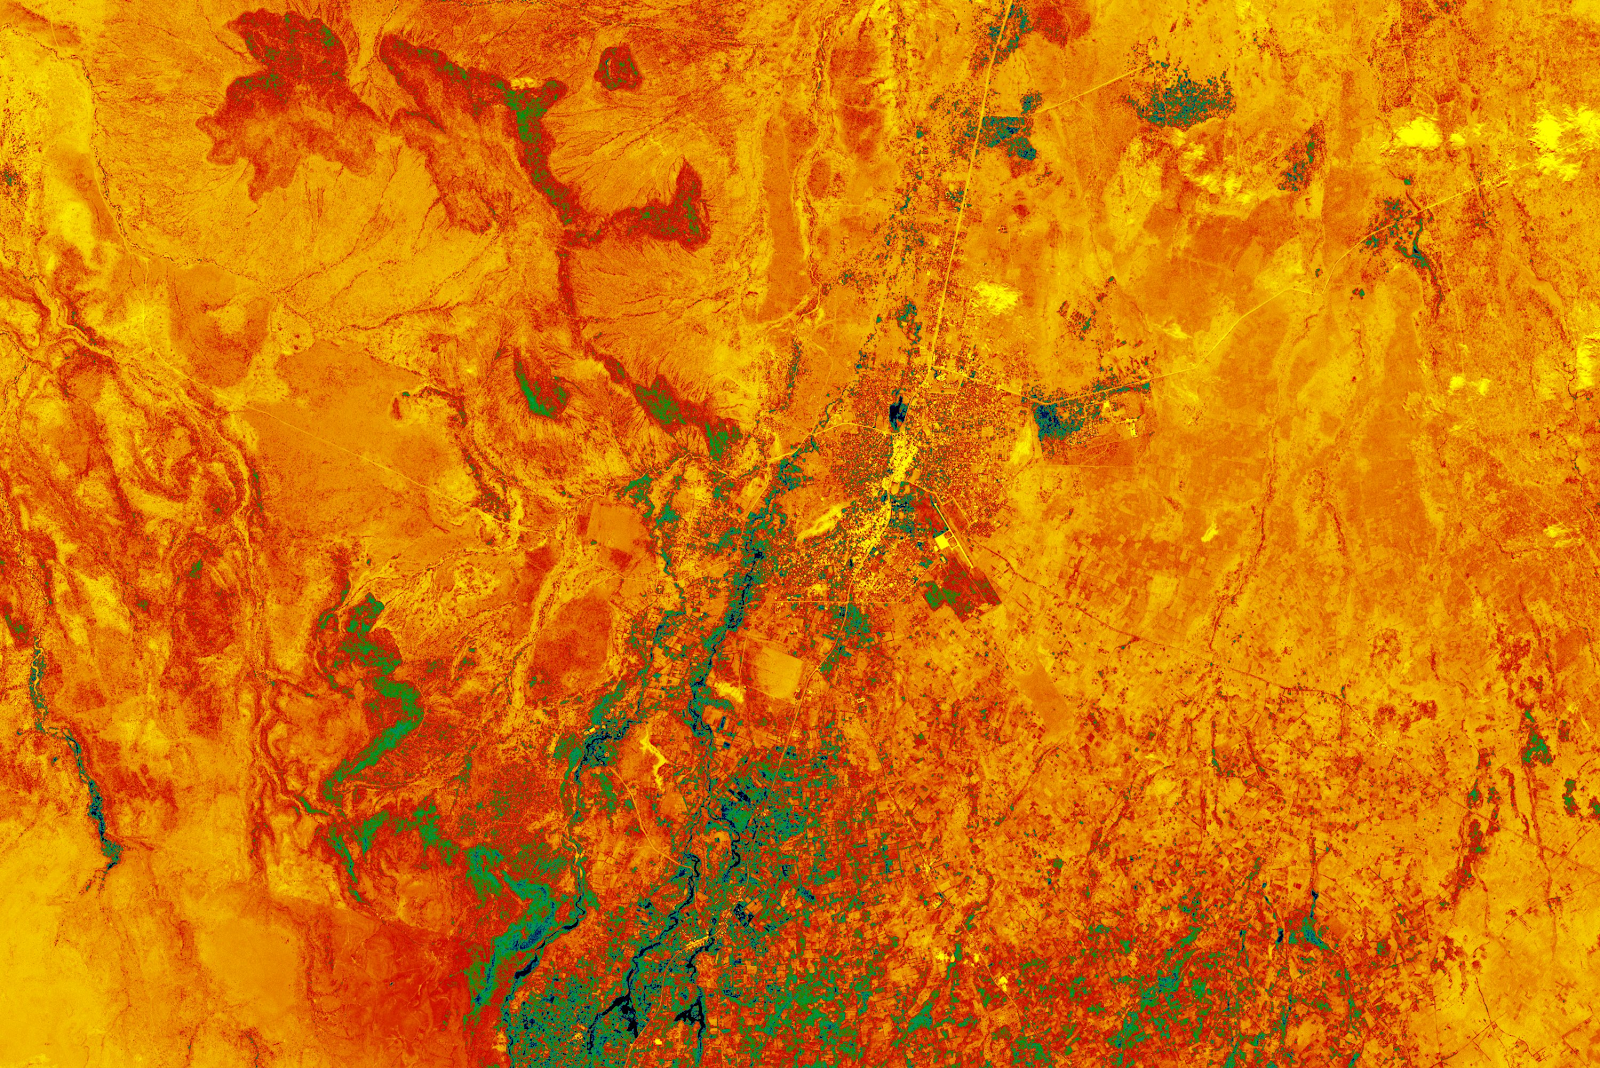
For Earth Observation module we use virtual Cloud server managed by Plan4All. Cloud is based on Open Stack and as software for processing images we select  Orfeo ToolBox – Open Source processing of remote sensing images. There will be used as input data terrestrial data from Citizens Science APPS and also data prepared by QGIS. Linkage of Orfeo ToolBox will be also provided for better interaction.  We also start downloaded some data from region. See examples:

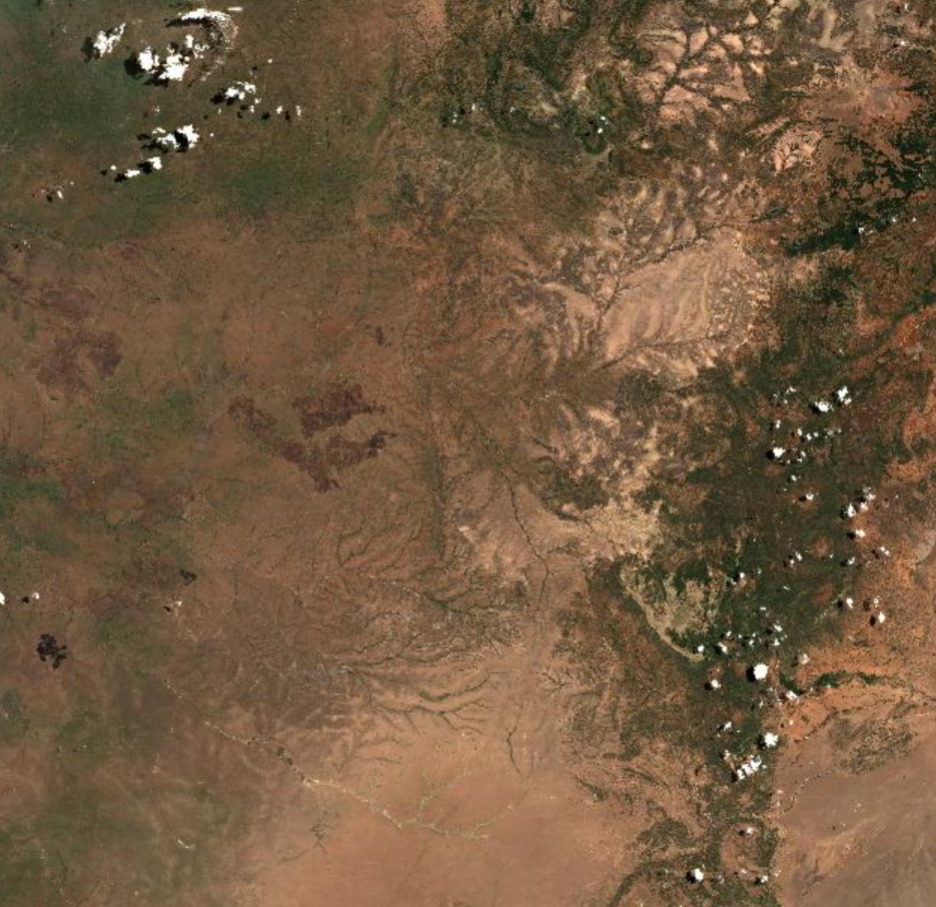
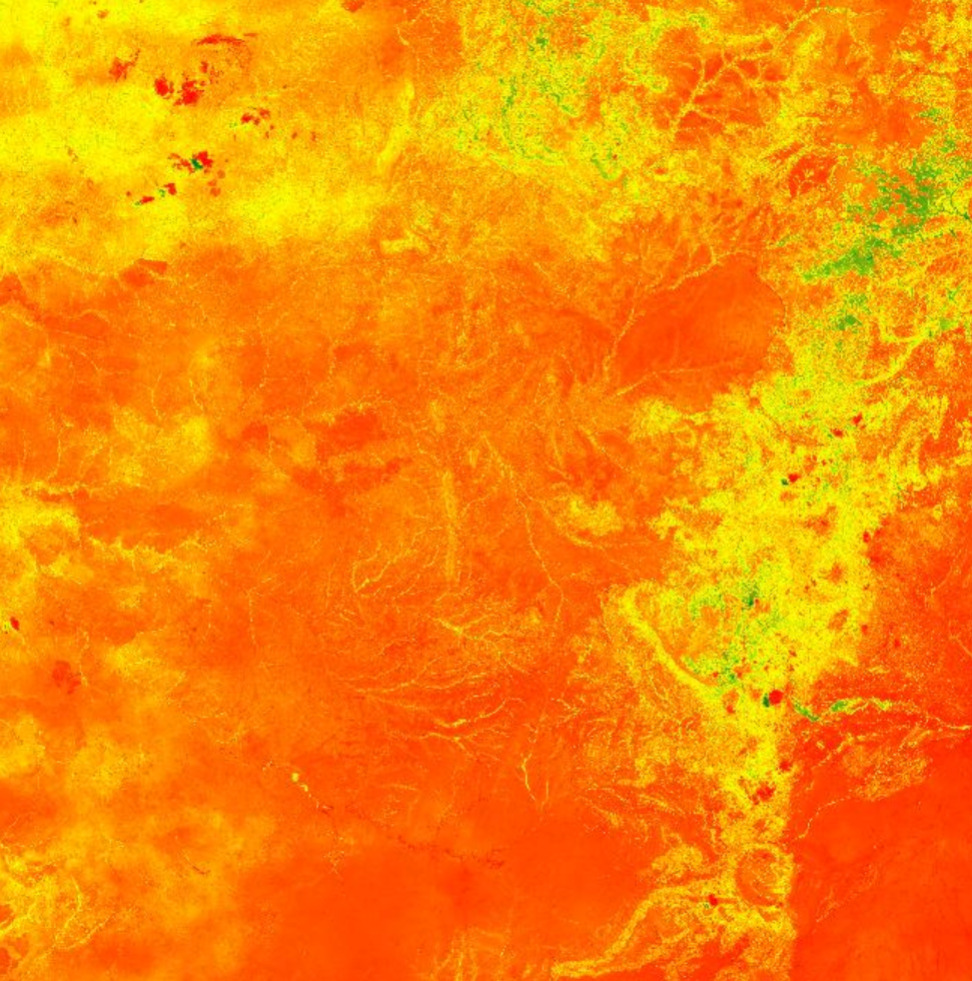
Data will be available also as WMS services.

Integration of Existing Citizens Science data

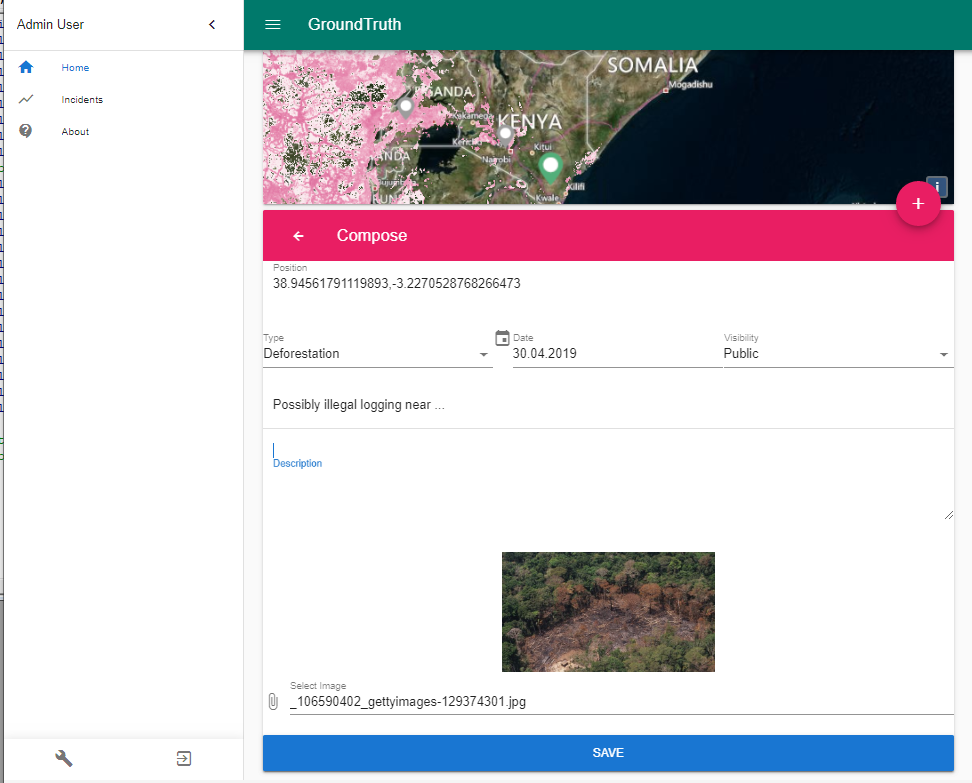
There are many use cases where satellite imagery needs to be validated by people on site. Some are related to environmental challenges, some can be oriented on fighting crime and we are sure there are many more, but one thing they mostly have in common: position needs to be specified and described by qualitative and quantitative means.

During Inspire hackathon we have developed a configurable platform (demo at https://groundtruth.plan4all.eu/) for input and storage of point features together with description, time dimension, some classification means and possibility to upload image of a earth observation, which the community then validates. The validation is done by voting (approve / disapprove), providing more precise measurement in numerical form and uploading additional photos and/or comments.

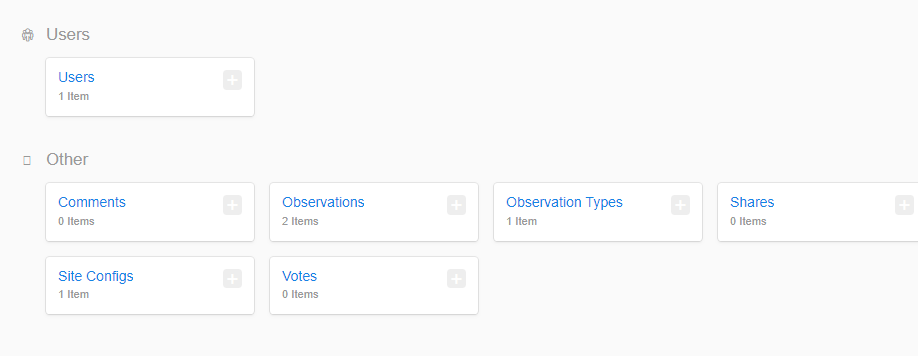
The groundtruth validation platform is an open source project consisting of javascript based frontend and backend (vue.js + Keystone.js + Express.js + Mongodb) and Android oriented application developed in Kotlin. Source code repositories are located at https://gitlab.com/raitisbe/groundtruth-web and https://gitlab.com/raitisbe/groundtruth

TEAM 3 Progress Report I

Open Land Use for Africa (OLU4Africa)

This is the first progress report of the team No. 3 of the Nairobi INSPIRE Hackathon 2019. The team is led by Dmitrii Kozuch.

You can watch the webinar recording of this team below.

In the first stage the work is more oriented on the technical development rather than contacts with the community. The work went into two parallel directions that will be described in this progress report. The ultimate goal of these two directions is to enable land use/cover classification and segmentation of satellite imagery.

The first direction is relying on creating classification models using Sentinel-2 imagery, OpenStreetMap database and Keras (with Tensorflow backend) library.

The first steps are relying in collecting training and validation data for different types of land cover/use.

The example of data collection of aerodromes is following with single steps:

1) Download latest Kenya OSM database from the pages: http://download.geofabrik.de/africa.html

2) Import osm file into PostgreSQL database using osm2pgsql tool:

osm2pgsql --slim --username user_name --hstore –database database_name  -H host_name kenya-latest.osm

3) Use script to download aerodromes images:

#Import SentinelAPI library (useful for getting metadata for Sentinel products)
from sentinelsat import SentinelAPI
api = SentinelAPI(user_name, user_password,'
https://scihub.copernicus.eu/dhus')
import datetime
import requests
import shutil
import psycopg2
import psycopg2.extras
 
#Establish connection where osm2pgsql has saved latest Kenya OSM data
connection=psycopg2.connect("dbname=database_name user=user_name password=user_password host=host_name")
cursor=connection.cursor(cursor_factory=psycopg2.extras.DictCursor)
 
#Select osm_id, centroid and geometry of all aerodromes in OSM database
cursor.execute("select osm_id, st_astext(st_centroid(st_transform(way,4326))) as centroid, st_astext(st_flipcoordinates(st_transform(way,4326))) as geom from planet_osm_polygon where aeroway='aerodrome'")
aerodromes=cursor.fetchall()
connection.close()
 
folder='folder_to_save_images'
 
#For each aerodrome from Kenya OSM database
for aerodrome in aerodromes:
            #Query all images from Sentinel-2 products in year 2018 that had cloudcoverage less then 5
            products = api.query(aerodrome['centroid'], date=(datetime.date(2018, 1, 1),datetime.date(2019,1,1)), platformname='Sentinel-2', cloudcoverpercentage=(0, 5))
            #From the queried products select the one with the minimum cloudcoverage
            product=list(products.keys())[0]
            min_value=products[product]['cloudcoverpercentage']
            for p in products:
                        if products[p]['cloudcoverpercentage']<min_value:
                                    product=p
                                    min_value=products[p]['cloudcoverpercentage']
            #Get timestamp when the selected product was collected
            date=products[product]['beginposition'].strftime('%Y-%m-%dT%H:%M:%SZ')
            #Create url link to download image from mundi WCS for the selected object for the selected date
            url='http://shservices.mundiwebservices.com/ogc/wcs/d275ef59-3f26-4466-9a60-ff837e572144?version=2.0.0&SERVICE=WCS&REQUEST=GetCoverage&coverage=1_NATURAL_COL0R&FORMAT=GeoTIFF&SUBSET=time("%s")&GEOMETRY=%s&RESX=0.0001&RESY=0.0001&CRS=EPSG:4326' % (date,aerodrome['geom'])
            #Download and save image
            r=requests.get(url, stream=True)
            if r.status_code == 200:
                        with open(folder+str(aerodrome['osm_id'])+'.tif', 'wb') as f:
                                    shutil.copyfileobj(r.raw, f)

As a result it is 70 sample images that could be use for training and validation of airports and classification model. The model itself will be trained in Keras library using Convolution Neural Network algorithm. There were lots of similar intentions for various image classifications implemented in Keras. Here is an example to classify CIFAR-10 dataset – https://keras.io/examples/cifar10_cnn/ . The dataset itself is composed of 6 000 images for each following class: airplanes, cars, birds, cats, deer, dogs, frogs, horses, ships, and trucks.

Obviously except the problem with classification we need to tackle problem with image segmentation. So far it wasn‘t time to research existing algorithms for this.

The second parallel way that it is worked on is to use eo-learn library and Africover dataset (http://www.un-spider.org/links-and-resources/data-sources/land-cover-kenya-africover-fao ) for the land cover classification. The tutorial doing this is found on the official library web page:
https://eo-learn.readthedocs.io/en/latest/examples/land-cover-map/SI_LULC_pipeline.html

It has been attempted to use the code provided, however there are some error emerging here and there. Thus there is a need to debug the code. The eo-learn library is quite young and thus it is natural to expect some bugs. All in all priority will be given to the first way because it has been tested many times so far and generally could give accuracy of classification higher than 70% . The only thing is that sometimes it could be too few samples to train and validate models so it will be need to download samples from the other countries in Africa.

TEAM 5 Progress Report II

TEAM 5: Agriculture Innovation Hub for Africa

This is the first progress report of the team no 5 of the Nairobi INSPIRE Hackathon 2019. The team is led by Karel Charvat and Tuula Löytty.

This time, the team is presenting one of the key components of the technical solution which is the open metadata catalogue Micka.

(Open)Micka is a Web application for management and discovery of (geo)spatial (meta)data. From a user perspective, it represents a cataloguing tool for searching and finding relevant resources, such as geospatial and non-geospatial datasets, Web services, sensor measurements, map compositions, (traffic) models, documents, Web pages, reports, legislation or e-shop. The main goal of (Open)Micka is to connect all the relevant kinds of resources and provide answers, for instance, to the following questions:

  • show me all data and (map) visualizations that were developed according to such legislation or
  • show me what has been done with such sensor measurements (derived datasets, policy, link to e-shop selling the raw sensor measurements,…).

As such, (Open)Micka is intended to be used as a tool for discovery of various kinds of resources. (Open)Micka is a customizable and scalable tool that is going to be modified according to the purposes of each pilot. Anyway, a general use case scenario may be identified as follows:

  1. A user would like to discover relevant information regarding his/her area of interest, theme and other preferences. A user e.g. searches for all kind of available information related to European Noise Directive in the area on the border of the Czech Republic, Slovakia and Austria.
  2. On contrary to Web searching engines, the (Open)Micka enables to define advanced (multiple) searching criteria, such as to draw a rectangle in a map to define the area that I am interested in, to define quality of information I am interested in (such as spatial accuracy higher than one meter) or to define the responsible authority. E.g. I would like to obtain only noise measurements from official mapping authorities.
  3. A user than obtains relevant (meta)information on all the available resources he/she was searching for. He/she may look into details as well as see all the related resources that provides links to other applications. E.g. a user discovers a NoiseDataset that fulfils all his/her criteria and would like to see a preview of such dataset on a map, see the legal act under which the dataset was created, have a link for the sensor measurement that was conducted in order to populate the NoiseDataset or use a link to the e-shop to buy the dataset.
  4. From a producer’s perspective, a producer may import his/her metadata from another system or create them manually.
  5. A producer than decides which metadata will be published, i.e. made available over the internet.

More illustratively, an (Open)Micka allows users to:

  1. Find the relevant information resources
  2. Between the following information resources: geospatial and non-geospatial datasets, Web services, sensor measurements, map compositions, (traffic) models, documents, Web pages, reports, legislation or e-shop.
  3. Define criteria from dozens of so-called queryables as specified in the OGC implementation specification Catalogue Service for Web 2.0.2, including the ISO Application Profile 1.0. The typical examples are freetext search, resource type, area of interest, scale extent, responsible authority, time period etc.
  4. Since (Open)Micka provides services, it may be easily connected and powering a third party application.
  • Display the results
    • In a human friendly way on a Web page and/or in an application for mobile environments.
    • In an XML-based source code.
    • Through a semantic approach when using the GeoDCAT RDF syntax.
  • Import metadata
    • From another server having its interface compliant to the OGC implementation specification Catalogue Service for Web 2.0.2.
    • From another repository when a connector is developed.
  • Create metadata
    • According to a currently support metadata profile: ISO 19115, ISO 19119, INSPIRE, Dublin Core, Feature Catalogue.
    • According to a user-defined structure.
  • Validate metadata
    • According to the linked XML schemas.
    • According to a Schematron pattern.
    • According to user-defined rules.
  • Publish metadata
    • In a user-friendly Web page through XML files.
    • As a Web service, with or without semantics.

TEAM 4 Progress Report I

IoT Technologies for Africa

This is the first progress report of the team No. 4 of the Nairobi INSPIRE Hackathon 2019. The team is led by Michal Kepka.

The team consists of 51 registered members in total, but only few of them are actively communicating. The structure of the team from countries point of view is very diverse, we have members from Kenya (16), Ghana (6), Nigeria (6), Uganda (3), Czechia (2) and 18 members from 18 other countries.

Here is the webinar recording of this team:

From the expertise point of view, we have experts from agriculture, fishery and forestry domain, IT and GIS experts as well as researchers. The lack of communication can be seen in the structure of selected projects amount. More than half of members have chosen more than 4 other teams to cooperate with. In that case Hackathon have potential to present results from synergies across more teams.

The team has shared document for textual work space and Skype group for
operative communication.

The team has identified several challenges:

  • Research of available sensor data sets in the region of interest
  • Research of used communication technologies
  • Integration of some sensor data sets from different data provide

Installation of SensLog instances has been prepared during last week. Team members will have opportunity to test first release of SensLog v2 during the Hackathon period. In cooperation with Team 8 a special task was defined, to design SensLog module for version 2 for collecting and storing VGI in the database.

TEAM 5 Progress Report I

TEAM 5: Agriculture Innovation Hub for Africa

This is the first progress report of the team no 5 of the Nairobi INSPIRE Hackathon 2019. The team is led by Karel Charvat and Tuula Löytty.

Team building: The team includes about 120 members out of which 20 are actively contributing.

Communication: We have established three communication channels: a Google Drive folder, Skype chat group and a mailing list.

Raising awareness:

  • Webinar for group was organised on 8.4.2019. See the webinar recording below:
  • A teleconference that took place 12.4.2019.

We have put efforts on two parallel tasks:

1.  We have collected ideas and wishes, what will be important for the African community. The ideas which are so far presented are below. The discussion and ideas collecting continues.

1.1 Sahara desert

1.2 Rural commodity exchange hub RCE

1.3 Main problems

2.  We want to prepare a social space for agriculture in Africa in a form of a Digital Innovation Hub. The following three topics are in progress:

2.1 The first technology solution schemas has been drawn

2.2  Visual outlook of the Innovation Hub aka SmartAfriHub.org

2.3 The initial analysis has been published.

1.  We have collected ideas and wishes, what will be important for the African community.

1.1 Sahara desert

African peoples can innovate by introducing agriculture in adversity land, others succeeded on this agriculture hard way, Africa will be strong with agriculture innovation even in the desert.  (Kantiza Antoine)

1.2 Rural commodity exchange hub (RCE)

This is a market center in rural areas where agricultural produce such as maize, beef, fruits,milk, wheat, bananas, barley and eggs are traded just it happens in Nairobi Security Exchange.

RCE is a reliable interface for buyers and sellers to meet thus eliminating brokers and illegal trader. More importantly, even if the farmers will not trade through the RCE, because if its transparency around the pricing, all the farmers in the country can use the RCE price as the reference price.

The RCE will work as a membership-based system. A members of the exchange will have to buy membership seat, you use that seat to trade either on behave of yourself or clients who you may sign up. The members of the exchange who trade may be either farmers or the buyers such as processors, flour millers, exporters, roasters, etc.

Beside the exchange providing the platform for buyers and sellers to physically or virtually meet, the RCE will work as an umbrella for all farmers’ cooperatives and management experience to the . As an umbrella of cooperatives, RCE will assist and help in bringing in knowledge, technology cooperatives.

The RCE will establish the quality, grade, quantity and payment, and delivery procedures. That’s a very bid value-add proposition to the market- you don’t beg people to pay you or chase after them.

RCX will work as farmers cooperative and in partnership with of the market actors, members of the exchange and government.

1.3 The main problems by Patrice Lekeraho Mirindi

For any big innovation for African Agriculture, we need to go through a overview of problems of the African agriculture and think about innovative ways to tackle those issues. I can summarise the issues into 3 main issues:

  • Production and productivity
  • Market failure
  • High transaction cost

1) production and productivity

To tackle this issue, we really need to restart almost everything, African agriculture need to change. And with the issue of climate change this has to be taken as a priority.

For the production part, we need to understand that african farmer are pretty good and efficient in what they do, to think otherwise can be wrong, a low yield does not mean inefficient. What is needed is an improvement of technology. Moreover, climate is something that cannot be control but can be predicted. African Agriculture and farmers need innovative ways to predict what will be the weather, they need a platform that will inform about when to plant, when to put fertilizer, when to harvest and more. They also need to be trained and inform about climate smart agriculture. At the climate issue, it is also important to think about a geographical distribution of agricultural activities. A map that can show some comparative advantage towards crops and animals.

For the productivity part, of course we need technology. but we need to consider the population-land ratios. At this level some more radical strategies need to be considered. African farmers have very small land, very few have upto 2 ha of land. This reduce their competitiveness. It is hard for 100 farmers sharing 200 ha to compete with one farmer with 50 ha. Many aspects count especially in term of resilience, input cost and market. Here, it requires a collaboration with other sectors. Agriculture himself cannot make it. We need to make other sectors to be attractive, accessible for african people. This will create space in rural areas and lands to develop the agriculture sector. Also, we have to think about an organisational model in which we will make farmers to work in cooperatives and use their land as one.

2) Market failure

The responsibilities are shared, at the farmers’ level, buyers level and institutions. We have to find strategies to fight against the opportunistic behavior of African farmers and buyers. It is important to build trust. This can be done through training with farmers. In order to get a developed agriculture in Africa, we need to be competitive. Our product needs to meet the international standard. Once again today technology, platform for climate, the geographical distribution of agricultural activities, organisation of farmers in cooperative for commercialization purpose are needed. Here we have to understand that much focus on smallholders hinder poverty reduction. They have to be in groups rather than dealing with single farmers, this will permit the action to have more impacts.

It is said that when the product is of good quality it sells himself. But African product have already a bad reputation. It requires to put some efforts in the publicity of african product. Put in place policies that favour the marketing of product. By promoting free trade of agricultural product as we need to promote a geographical distribution of agricultural activities.

Government has to remove taxes to farmers and people in agribusiness. Put in place policies that will protect them from buyers (Knowing that farmers are poor, some buyers take advantage and give them very small money). We need to improve the conservation of products.

3) High transaction cost

The main issue here is information asymmetry. It is important to make a platform that will give correct information about what is happening. We need to know exact information of what farmers are producing in a given village in Africa. The platform need to inform farmers about the need on the market.

There are also many issues of property rights and communities lands. This leads to many political issues; to conflicts between crop producers and animal producers. It could be interesting to think about ways to tackle the issues.

2. We are preparing a social space for agriculture in Africa – a Digital Innovation Hub.

2.1 SmartAfriHub – the first release of components

Currently is implementing Open Stack as basic tools for Innovation Hub. There were also registered domain smartafrihub.org.

2.2  Visual Oulook of SmartAgriHub.org.

Together with implementation of portal components we are working on design. See the first ideas

2.3  The initial analysis has been published

We have prepared a document for collecting ideas for implementation. The idea analysis outlines the goals, the target groups of the innovation hub and the desired functionalities.

TEAM 1 Progress Report I

Food Security in Relation to Earth Observation (GEOSS and COPERNICUS relevance)

This is the first progress report of the team no 1 of the Nairobi INSPIRE Hackathon 2019. The team is led by Karel Charvat.

The team includes 115 members out of which 25 are actively participating.C

The webinar of this team was organised on Monday 15th April 2019. The recording of the webinar can seen below.

We started collecting answers on a few questions. The key questions are listed below.

Why I would like work in this group?

Food security is a major challenge in Kenya and Africa at large considering the country’s economy is largely agrarian. Any unforeseen changes in weather patterns could be fatal not only to our economy but also to millions of people who rely on agriculture for employment and as a source of livelihood.

Food and nutrition security is my major areas of expertise therefore, I am always willing to participate in anything that can help to improve my knowledge in the area. Besides the major importance of food security in the development at a individual, micro and macro level, I believe that I will be more efficient in this team and I will participate significantly in the team.

Food (and water) insecurity are a consistent drivers of vulnerability in Africa. I wish to be part of the solution to food insecurity problem by collaborating with other interested experts and stakeholders.

Where Earth Observation can help to African Agriculture?

Soil management can benefit a lot from earth observation. Modelling erosion would help avert loss in soil fertility.

Near real-time crop monitoring data would be very helpful to farmers to enable them identify remedies to crop failures in good time and avoid losses.

The same data could assist government plan in advance in terms of addressing the anticipated deficit in food stock hence avert cases of food shortage.

Earth Observation will also be very important in prediction analysis in the agricultural sector. This will permit African Agriculture to be economical and technically efficient. It can also permit African countries to specialise in into different sector, therefore, develop trade agreement..

In highlighting the suitable areas for different agricultural practices and the hotspots of food insecurity. As any other thematic area, agriculture has a geographic dimension that can only be captured and revealed by accurate and dynamic earth observation data.

Earth observation can be used to assess risks/threats to sensitive ecosystems like forests and wetlands. Forests and wetlands are known contributors to food security particularly when sustainably used.

EO in particular weather data and biomass can be used to generate index based services for Banking and insurance such as Weather and Yield index (Kizito)

Ideas about potential experiments?

Sampling plots from different agro-climatic zones in Kenya and monitoring their growth using earth observation techniques together with ancillary data like weather data and biophysical data.

Also establishing crop growth scenarios under different weather events could help in projecting future yields which is very critical in the planning operations and budgeting by state agencies and county governments.

Prediction of disease susceptibility of crop using the temporal crop dynamics from earth observation data. Using historical data of crop disease and connecting them with features extracted from earth observation data for generating alert of probable crop disease.

To make some experiments only based on observation data and compare the results.

A combination of agent-based models of human activities and how these contribute to food (in)security and a dynamic changes in the environment as captured by big earth observation data.

Accurate monitoring crop phenology to aid the application of farm inputs like fertilizers, irrigation and farm management.

Assessment of hydrological flows through a combination of field observations and output from satellite image analysis workflows.

Augmenting weather and climate monitoring through the use of affordable in-situ weather sensors and remote sensed weather estimates.

Who are main target groups of farmers in your country?

In Kenya, some of the significant farmer groups include maize farmers in the rift valley region and in the western part of the country, rice farmers around lake victoria and in the Mwea scheme in the central part of the country, and sugarcane farmers in western, rift valley areas and in the coastal parts of the country

Do you have practical experience with implementation of EO in your country?

I (Parmita Ghosh) do have for my country India and Germany (I was an exchange student in Technische Universität Darmstadt, Darmstadt, Germany).

I have experience with Copernicus Data for climate monitoring (Kizito)

I have a background in applied geoinformatics and am currently using earth observation data to address water and food insecurity questions in the dryland regions of Kenya (Francis Oloo)

Can benefit small farmers from EO?

Sentinel 1, 2 has spatial resolution of 20 m so small farmers can be benefited by the products developed using images from these satellites.

Landsat can particularly be used for awareness creation on issues like land degradation and land use change and its influence on land health and the potential areas that can be used for farming.

On Friday 19th, we organised  teleconference with participation of 12 people. The main conclusion are next

Jiri will prepare infrastructure for experimentation. This will be done with Team 5

Jiri will download examples of Sentinel Data from Region

Other data will be downloaded on demand. There is expected also cooperation with team 3, 5 and 6.

In cooperation with team 3 we will tested different OS software. See the candidate.

  1. Orfeo ToolBox – Orfeo ToolBox,
  2. https://github.com/sentinel-hub/eo-learn,
  3. ESA SNAP software (http://step.esa.int/main/download/)
  4. QGIS – (Kizito)

For next communication will be organised Skype communication for the group.

TEAM 2 Progress Report I

Climatic Services for Africa

This is the first progress report of the team no 2 of the Nairobi INSPIRE Hackathon 2019. The team is led by Karel Jedlicka.

There are in total 83 team members registered, 11 of them are actively collaborating and contributing. The active members are from: Czechia (3x), Switzerland (2x), Zimbabwe (1x), Uganda (1x), Nigeria (1x) and Kenya (3x).

The team is currently working on a use case: a farmer uses meteorological data to plan maize planting and cultivation.

  • The farmer sends a field position to the climate service
  • The service returns
    • Growth plan – a time interval when to start planting to maximize yield
    • Nitrogen plan – a time interval when to insert nitrogen fertilisation to maximize its effect
    • Insect pests alert – alert when a risk of insect pest attack is high

The team has defined the concept, team assigned roles and answered open questions. The implementation will take part during the second half of April 2019.

Climate data for maize cultivation – more granular GRID for temperatures?

Here you can see the recording of the webinar taken a couple of week ago:

TEAM 9 Progress Report I

Open Transport Map (OTM) Applications for Africa

This is the first progress report of the team no 9 of the Nairobi INSPIRE Hackathon 2019. The team is led by Daniel Beran.

Team:

  • active team members: Daniel Beran, Jan Bohm, František Kolovský, Jan Sháněl
  • team members that have filled the Google Document but were not present for initial Skype call: Antoine KANTIZA, Candido B. Balaba, Jr., Laura Mugeha, Davince Koyo

Work:

  • We have acquired OSM data and preselected those layers that could be usable for traffic modelling.
  • We are discussing setting of parameters in transforming OSM data into traffic generators.

Plan for next week (15-21/04/2019):

  • Skype telco with all team members on on Tuesday 16th of April, at 1 p.m. CEST
    • Assigning unassigned work within our team: e.g. traffic generators, calibration data
  • Prepare traffic network and traffic generators from OSM data.
  • Moving prepared traffic data to STM developers.

Webinar from last week:


TEAM 7 Progress Report I

Smart Points of Interest – Publication of Open Data in Africa as 5-star Linked Open Data

This is the first progress report of the team no 7 of the Nairobi INSPIRE Hackathon 2019. The team is led by Otakar Cerba.

The goal of this team is to publish selected spatial open data from Kenya and other African countries as 5-star Linked Open Data (LOD). The datasets will be transformed and integrated into the Smart Points of Interest (SPOI) data model. The data model for the SPOI was designed during the SDI4Apps project and provides a universal exchange approach to publish point based data in RDF format according to the the linked open data (LOD) principles.

Team 7 Smart Points of Interest – Publication of Open Data in Africa as 5-star Linked Open Data performed the following activities in the past weeks:

  • Webinar (Friday 5 April, 10am) – during the webinar the Smart Points of Interest (SPOI) and initial statements of the team were introduced.
  • Shared folder development – the folder contains presentations about SPOI in general, SPOI in Kenya, SPOI data model and Team 7 ideas; there are also shared documents to add new ideas or comments to Team 7 activity and new data resources for transformation to SPOI.
  • Ideas collection
    • To find relevant open data resource for SPOI,
    • To design and realize harmonization processes of existing data to SPOI
    • To discuss future development of SPOI Ontology
    • To find business opportunities for SPOI, to define benefits of using SPOI (and 5-star LOD in general) for real GIT solutions
    • Landing pages for Kenya
    • Search for Web pages in Kenya
  • Data resources collection – Health Facilities in Kenya and data resources from Team 2

The Team 7 has registered 29 participants (2 from Asia, 8 from Europe and 19 from Africa). Twelve participants were registered to the webinar, but only four participated actively. An overview of the countries represented in this team is shown below.