TEAM 15: API for Analysis and Prediction of Fuel Consumption

TEAM LEADER: Christian Zinke-Wehlmann [InfAI]

TEAM MEMBERS: Jörg Schließer [InfAI], Willy Steinbach [InfAI], Moritz Engelmann [InfAI]

PROJECT IDEA:

The main idea is to create an API for analysis and prediction of fuel consumption. Up to now, our focus lay on fishery vessels that are supposed to travel from their current location to a new destination. Given some surrounding conditions and internal measurements we analyze and predict the fuel oil consumption per nautical mile using statistical methods. For training and testing purposes we were provided with full datasets from two vessels over several years each. The overreaching goal is to make live suggestions on how to minimize the consumption for the duration of the travels.

The goal for this Hackathon is to create a RESTful API to be able to access the generated models and make predictions given new data on the fly. We plan to finalize the requirements for the API and have a working prototype by the end of the coding sessions.

TEAM 14: Analytical Map of Incidents Registered by the Municipal Police in Plzeň, Czechia

TEAM LEADER: Jiri Bouchal (InnoConnect)

TEAM MEMBERS: Jan Ježek (InnoConnect), Alvaro Silva (InnoConnect), Václav Kučera (SITMP)

PROJECT IDEA:

Problem we solve

There is a lot of big data available in the connected cities of today. Often, this data is stored for restrained purposes without any deeper analysis and visualisation.  Users thus do not benefit from the data and from its understanding that would allow them to act based on the information obtained from data. Cities usually do not know how to work with their data further to get the knowledge out of it that could support the decision making.

Solution

The proposed application will help the city of Plzeň (Czechia) to  identify trends and patterns in their security-related data provided by the Municipal Police, e.g. to identify areas with the highest risk of minor criminality, streets with most frequent parking, driving or speed violations, locations with pedestrian or cyclist offences, or neighbourhoods with alcohol- and drug-related offences. The web application will bring the data into a map and make it possible to analyze it for trends and patterns.

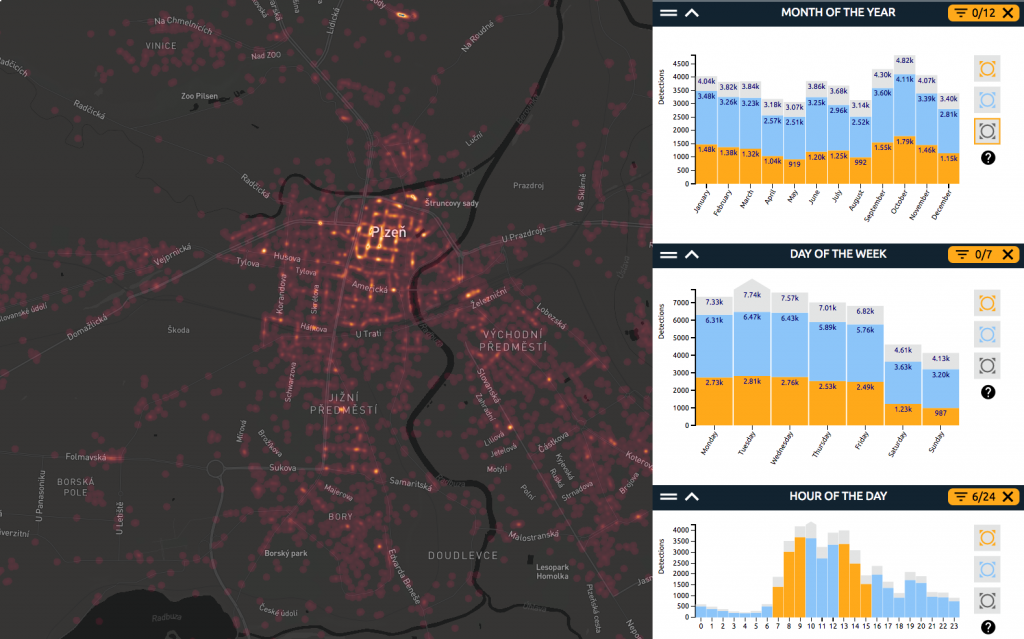
It will allow interactive analysis of large spatial data, using WebGLayer heatmap technology.

Thanks to the solution, users will benefit from visual insights obtained from the data. They can drill into the data, look at different combinations of attributes (such as specific hours or days of the week), and understand where the records and the riskiest areas are located on the map.

The city’s manager for criminality prevention can use the solution to discover locations where the city security police measures should target. Police commanders can use the app to identify most risky areas to which the police officers shall be sent to increase safety of citizens. The public can benefit from the higher awareness about the security-related issues in the city.

Technology

The product is a web-based map application coupled with analytical tools. It runs on WebGLayer (webglayer.org), a unique javascript open source library developed for rendering heatmaps with built-in dynamic data filtering.

Main Features:

  • Highly interactive
  • Instant reaction to user actions (response time below 100ms)
  • visualisation of up to 1.5 million data records

The library is based on WebGL and uses GPU (graphical processing unit)  for fast rendering and filtering of data. Using commodity hardware (an average PC) the library can visualise hundreds of thousand of features with several attributes through a heatmap, point symbol map.  The library can render the data on the map provided by third party libraries (e.g. Mapbox, OpenLayers, Leaflet, GoogleMap API).

Main advantages of our technology compared to common products on the market:

  • Interactive data filtering: Static images cannot provide sufficient representations of data, and a high level of interactivity is desired. Zooming and panning in geographic space is obvious, but interactive data filtering in various views that our solution provides is not a common feature nowadays.
  • Scalability: Efficient visualization is a key approach to understand large datasets. Scalability represents one of the key challenges from the perspective of visual encoding (the encoding must overcome visual clutter and over plotting) as well as interactivity performance. Our solution can efficiently visualise up to 1.5 data records while keeping low response times.
  • Interaction responsiveness (response time in milliseconds): Once interaction is enabled, the response time is essential. However, large-scale data requires advanced algorithms and approaches. Server side data processing may suffer from network latency. Our solution renders and filters the data on the client side using the GPU, no server side data processing occurs.
  • Modest hardware infrastructure demands: Traditional web mapping in geographical information systems (GIS) often demand infrastructure maintenance of spatial databases, and specific server side software such as MapServer or GeoServer.

Data

Incidents reported by the Municipal Police of Plzeň from January 1, 2015 to December 31, 2015.

No. of Data Records: 45216.

Data source: Municipal Police Plzeň http://www.mpplzen.cz/

The data for the first release of the application is provided as a sample DB export. It’s planned for the future that the data will be regularly updated and provided by the city through an API.

NOTE: even though the data was anonymised, it contains sensitive data that the owner of the data currently cannot make public. Therefore, due to security reasons, the dataset is currently not available as open data. The application will therefore be protected by a password and at this stage will not be available to public. However, it can be demonstrated during the hackathon presentations. It’s planned that after future prior agreement with the Municipal Police, a new release of the app might be developed with a subset of data that can be made available to public.

Support

The solution is developed within the PoliVisu project (polivisu.eu)

TEAM 13: Arctic Geodata and Fishery Statistics

TEAM LEADER: Torill Hamre (NERSC)

TEAM MEMBERS: Bente Lilja Bye (BLB), Arnfinn Morvik (IMR)

PROJECT IDEA:  The targeted area is sustainable aquaculture and bio-economy. We want to combine different types of met-ocean data (e.g. ice edge, SST) and fishery statistics to investigate potential links between climate change and activity in the polar region in and around Svalbard. We will evaluate if the FAIR principles are met for the chosen variables, using Copernicus, BarentsWatch and other open data resources. Accessibility and functionality of the related APIs will be assessed, and whether the chosen APIs can jointly provide new information.

APIs for candidate data sources:

IMR Zooplankton Norwegian Sea: http://metadata.nmdc.no/metadata-api/landingpage/71dd5275cb3bb9f57028dd7bcdc280a8

TEAM 12: Delimiting of Agro-Climatic Zones

TEAM LEADER: Karel Jedlička, Pavel Hájek

TEAM MEMBERS: Karl Gutbrodt, Marcela Doubkova, Apurva Kochar

PROJECT IDEA: The idea is to provide local Agro-climatic maps by processing detailed EO data and climate model data.

Current climate zones maps are very generic. These show large areas and display only some differences in topography. Characteristics such as seaside buffer zones, weather divides or South-North differences are usually not accounted. The idea is to provide local agro-climatic maps by processing detailed Earth Observation data for topography and land cover.

Such improvements in the climate zones would support local/within-field management strategies. For researchers it may be of interest to use this dataset for decisions related to field trial (climatic) representativeness. Agronomists and insurances may find this dataset useful for risk assessment.

Last but not least, researchers and advisors may find important to check the impact of climate change on given area and decide about future management strategies.

The local climate maps will take following factors into account:

  • General weather conditions (large-scale weather models)
  • Local topography (elevation,, with North/South slopes
  • Buffer effects, such as lakes, sea or swamps
  • Soil types.

Data sources:

  • Weather datasets: ERA5 (ECMWF), NEMS30 (meteoblue).
  • Topography maps: EU-DEM,
  • Land cover / soil maps (JRC)

TEAM 11: Expanding Open Land Use Map by Terrain Characteristics

TEAM LEADER: Karel Jedlička

TEAM MEMBERS: Marcela Doubková,  Dmitrij Kožuch

PROJECT IDEA: The idea is to expand Open Land Use map by computing main terrain characteristics of agricultural fields (LPIS blocks). So far for computation two datasets will be used 1arcsecond DEM dataset by USGS and Open Land Use map (for masking fields). The experimental area will be Weinviertel (province located in the norteast of Lower Austra).

So far it is possible to get the main terrain characteristics of the field by entering its unique id in Open Land Use dataset. For example here are those characteristics for the field with id 10145238 .

{‘min_elevation’: 186.64203, ‘max_elevation’: 196.92177, ‘mean_elevation’: 190.70232, ‘median_elevation’: 190.44339, ‘min_slope’: 0.7573741, ‘max_slope’: 1.5695069, ‘mean_slope’: 1.2346609, ‘median_slope’: 1.2555954, ‘min_azimuth’: -179.98296, ‘max_azimuth’: 179.62314, ‘mean_azimuth’: -13.073845, ‘median_azimuth’: -30.859669}

Otherwise as well as get the statistics it is also possible to download characteristics as TIF images:

TEAM 10: Location Intelligence from Multi-Variate Spatial Analysis

TEAM LEADERS: Runar Bergheim, Karel Charvat

TEAM MEMBERS: Petr Uhlir, Raitis Berzins, Dmitrij Kozuk, Milan Kalas

PROJECT IDEA:

A lot of energy has gone into the development of precision data both with regards to fundamental geospatial data such as basemaps and thematic data serving a single purposes for specific and narrow target audiences.  This idea seeks to use such data to elaborate detailed characteristics about places based on the co-occurrence of certain features or phenomena.


An example of how such characteristics could be used, let us consider the following. The accessibility of a place may be described in terms of its proximity to transport hubs for air, train and road transport. That gives a snapshot of the current state of the area; however — by incorporating planned and future developments, it is possible to characterize a place by how it is likely to be two years from now. The climate of a place can be described in terms of monthly averages, averaged over 50 years of aggregated data for precipitation, air temperature, sea temperature, cloud cover, snow cover etc. The terrain can be characterized in terms of its ruggedness, whether it is a platou, a plane, coastal, mountaineous or otherwise. There is a near infinite number of characteristics that can be considered — in themselves they are not necessarily particularly useful — but combined the right way they may predict trends and offer location insights that are useful both to individuals, private enterprises and regional development bodies.


I.e. by identifying all places in the mountains that has rugged terrain and that has a long and steady period of snow cover with cold frequent sunny days — and with a new infrastructure hubs being developed within 75 minutes drive away — but scores low on availability of visitor oriented services we have established a dormant economic potential. This sort of location intelligence is thus far the material of reports.


This team will be operating in a mixed technical and non-technical manner. On the one hand we will expand upon the business cases in an exploratory manner through conversation; on the other we will try to identify practical sources and algorithms to determine key characteristics for places, taking as a starting point a seed database of about 20 000 locations and a bunch of climate, land-cover and landscape characteristics that have already been calculated.

TEAM 9: SeWa – Sentinel Watcher

TEAM LEADER: Marek Šplíchal (Lesprojekt)

TEAM MEMBERS: Jan Sháněl (MUNI)

PROJECT IDEA: Map based web application for identifying of usable remote sensing data from Sentinel satellites. A user can choose one or multiple positions (for example fields, forests etc.) and the application prepare a forecast based on location, minimal satellite elevation and minimal crossing duration for Sentinel 2A and 2B satellites. The application calculates timetable of satellites crossing time and weather (clouds) forecast as a result. User gets information when his selected position(s) can be photographed and which imagery can be used for further processing.

TEAM 8: SPOI Data Enrichment

TEAM LEADER: Raúl Palma (PSNC),

TEAM MEMBERS: Otakar Čerba (UWB), Stein Runar Bergheim (AVINET),  Raitis Berzins (BOSC), Milan Kalas (KAJO)

PROJECT IDEA:  Smart Points of Interest (SPOI) increased the number of points from about 27M to more than 30M. The goal of this working group is to improve the SPOI dataset, both by extending and improving the underlying model (ontology), and to enrich the knowledge base with links to other relevant datasets.  Regarding the ontology, we aim to include properties definitions, mappings to other vocabularies to the current taxonomy of classes, and possibly additional terms for annotations/ratings,

Regarding the dataset, we aim to discuss and find possibility of linking with review/ratings datasets, relevant eurostat indicators, and others that may be identified during the hackathon.

TEAM 7: LPIS RDF Integration

TEAM LEADER: Raul (PSNC)

TEAM MEMBERS: Sam (PSNC), Vojta (Lesprojekt)

PROJECT IDEA: The idea is to integrate Czech LPIs data with other RDF datasets, including the definition of sample sparql queries based on relevant use cases. We will use FOODIE ontology. FOODIE ontology has been generated from FOODIE application schema (UML model), Revision 4.3.2, and translated into an ontology according to ISO/DIS 19150-2 with several modification using ShapeChange.

For the beginning we defined next use cases:

Use Case #1 – buffer zones around water bodies (user will specify the distance). Result is a new shp datasets which define the areas within the fields with limited/restricted application of agro-chemicals.

Input: water bodies + LPIS

Use Case #2 – select of Farm based on the ID_UZ attribute from public LPIS database and searching EO data over all fields

Use Case #3 – visualization of crop species based on the farm data (need parcels with crop types- not available from open LPIS data) + percentage of crops in graphs

Use Case #4 – select fields with different soil  types

Use Case #5 something more complex – to select all fields with certain crop in max distance from certain point (it could be for logistic, distribution of biomass etc)

TEAM 6: Sensor Data Streamed as RDF on the Fly

TEAM LEADER: Raul (PSNC)

TEAM MEMBERS: Sam (PSNC), Mike, Ondra (UWB)

PROJECT IDEA: SensLog is web-based sensor data management system. SensLog is a solution that is suitable for static in-situ monitoring devices as well as for mobile devices with live tracking ability.SensLog provides system of web-services with JSON format encoding or provides standardized services using core methods of OGC SOS version 1.0.0. The latest version of REST API is following CRUD schema.

The idea is to generate RDF data from SensLog on the fly, so that it can be streamed all the observations in real time.