
FINAL REPORT ON CHALLENGE #9: A new social space for geographic information sharing and education – tell us your own story about your region using story maps
Name of mentor(s): František Zadražil, Otakar Čerba, Markéta Kollerová
Number of participants: mentors + 7 registered participants + Vincent Onckelet + student team of Otakar Čerba (University of West Bohemia)
FINAL REPORT Challenge Nr. 9 [PDF, 17MB]
INTRODUCTION
Background of the challenge
Public sector, universities, research organizations, private companies, students and also citizens are now generating numbers of geographic information as maps or other graphical products. Most of these products are never shared or are available in the form with limited accessibility (pictures, printed maps). Our idea is to introduce a new concept of building story maps combining high tech web/cloud technologies with easy and efficient possibilities to enrichmaps with context and content. Such a solution could be used for education and training, but also for promotion of research results or public surveys. The goal is to support easy development and sharing geographical information and its visualization. This approach can result in close interdisciplinary cooperation and communication.
METHODOLOGY
The methodology of the report contains the sections that describe the progress and results achieved for the entire challenge.
Team description
Our team was led by the mentors: Otakar Čerba, responsible mainly for one of the use cases (Regional Attractiveness), then František Zadražil, the main developer of the technology and Hub4Everybody portal, and Markéta Kollerová, responsible for smooth communication within the team and participants.
We were able to organize a couple of overall meetings and 1 large webinar dedicated to Hub4Everybody technology, with an audience of registered 120 participants geographically covering countries throughout the whole Europe, then Africa, South America and also Asia.
Hub4Everybody recordings is available on the Plan4All Youtube channel:
https://www.youtube.com/watch?v=_t5mtReGjN4
We have also organized a separate practical workshop for students of Applied geoinformatics and cartography at the Charles University in Prague. The participants had a chance to publish and present their own maps in the portal by following the step by step instructions. Some demonstrative datasets and pages had been created in the context of the event. Eg. https://hub4everybody.lesprojekt.cz/demo-webinar/.
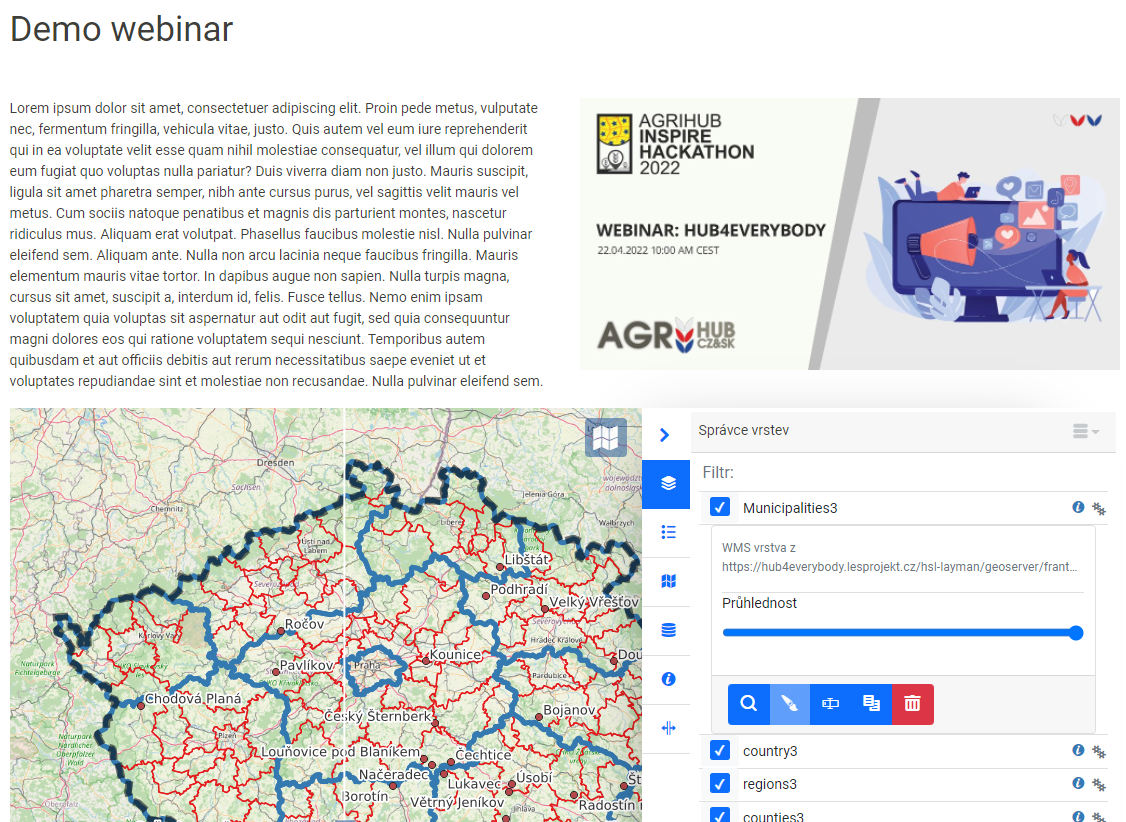
Figure 1. Sample web presentation created during the interactive workshop
In our team, besides the core team around the P4A organization, there were 7 registered participants from Uganda, Nigeria, Burundi, India, Pakistan, Uzbekistan, and Slovakia.
Technical infrastructure
Hub4Everybody is presented to the user as a single and complex solution and workflow for managing geo-data. But it is built upon multiple separate components. The basic architecture of the whole system is depicted in the schema (Figure 2).
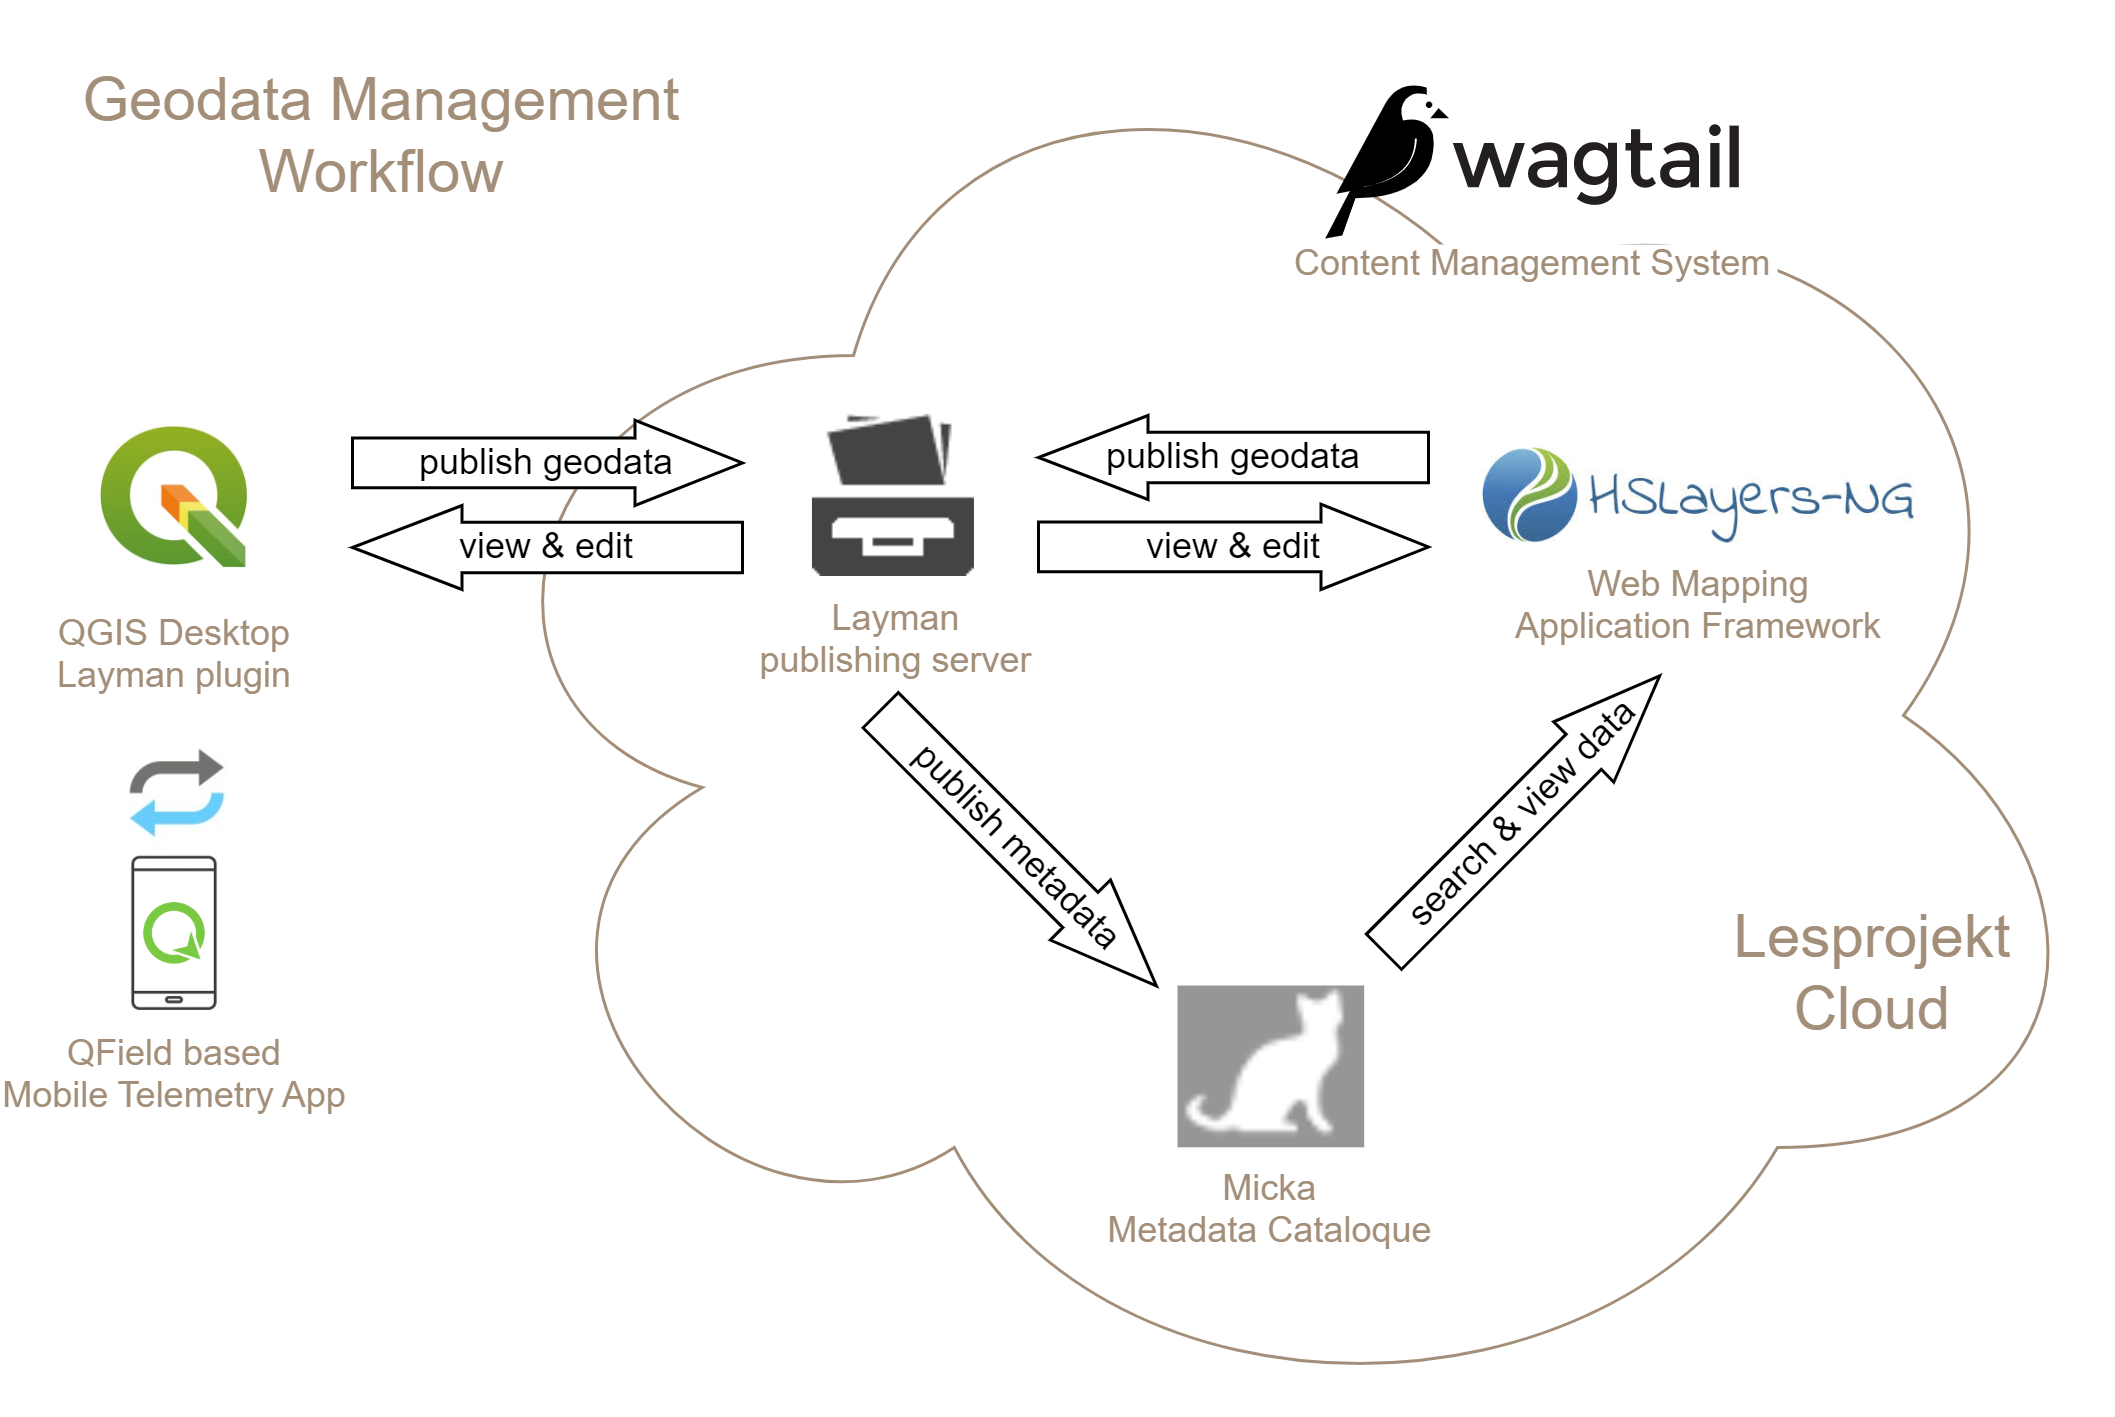
Figure 2. Hub4Everybody general architecture.
Content Management System (CMS)
The Editorial system represents a basic unifying element for geodata processing. This component allows for the creation of web portal content and also represents a natural junction for other parts of the system. Hub4Everybody uses Wagtail CMS (https://wagtail.org) Platform, extended by CodeRed CMS (https://www.coderedcorp.com/cms/). It is one of the leading open-source CMS used by small as well as large organizations (Google, NASA, British NHS). Wagtail is based on the Django system and the main programming language is Python. It enables very easy extension of the functionalities in the forms of widgets, web page templates, or extending of authorization and other system parameters. It is, therefore, possible to integrate it with other systems used within the organization (e.g. geoportal of a city), if such demand occurs. There is a huge community of developers behind the system, where more complements and extensions can be developed.
The default set of features has been extended to offer a larger set of web page elements including an interactive map application, see figure 3.
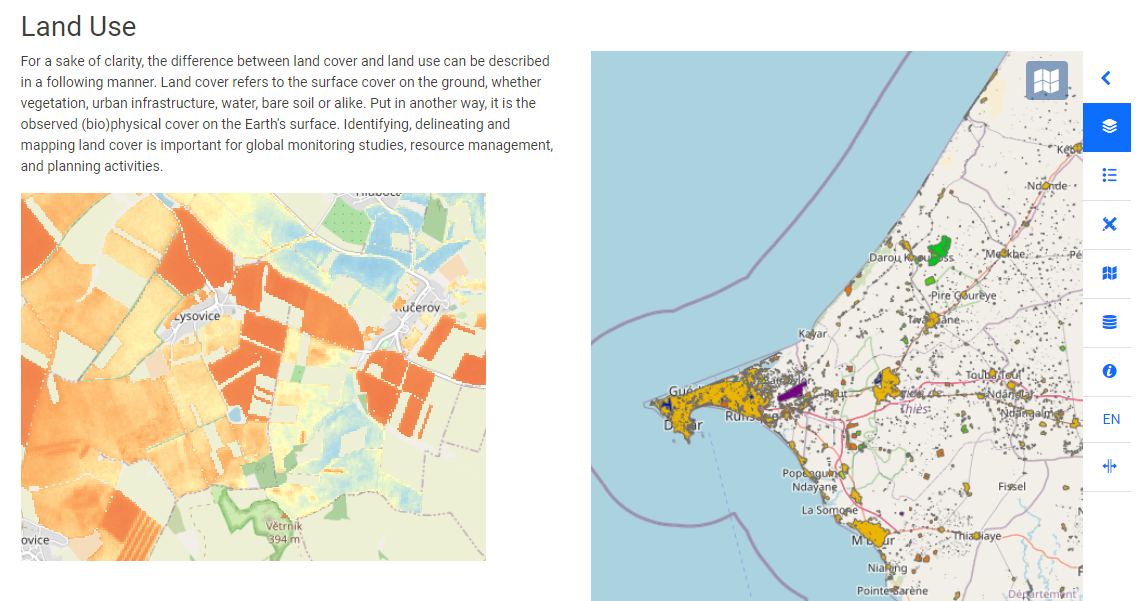
Figure 3. Example of a web page created by Hub4Everybody CMS including a map.
A web portal built by the content management presents the gateway for the user and unifies the rest of the system on the level of user identity. That means the user has one account to access all the components no matter if it is on a web platform or desktop application. Single Sign-On is ensured this way.
Web Map Application
The web mapping component (figure 4) uses the open-source mapping framework HSLayers-NG, see https://ng.hslayers.org/. This tool is built upon the basis of OpenLayers and enables significant customization and functional additions depending on the requirements of the system. At the same time, there is a functional integration to the Wagtail CMS in the form of a map widget, which allows easy creation of maps within all HTML pages of the content management system, including the detailed configuration of map layers and tools if required.
Important role of the web map is to publish geo-data in the form of single layers or complex thematic maps. Most common vector and raster data formats are supported (GeoJSON, Esri Shapefile, KML, GPX, GeoTiff, JPEG, PNG).
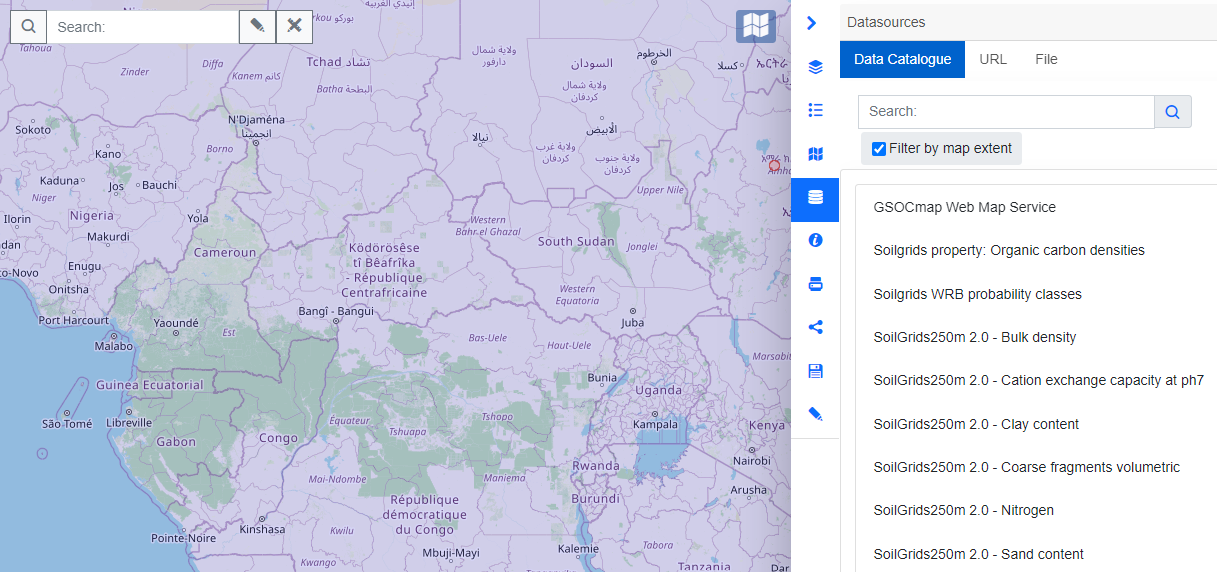
Figure 4. Web mapping component.
Desktop GIS Client
All the geo-data publishing tasks that can be carried out in the web application are available also via a desktop client. That is represented by a plugin for the most popular open-source GIS platform QGIS. The plugin is called “Layman” and is available through the native QGIS repository. Similar to the HSLayers web map, spatial data layers can be published as services and thematic maps composed of layers can be created using the Layman plugin.
Data Publishing Server
Both HSLayers and QGIS Layman plugin act as client applications which means they don’t do the actual data publishing but are using some other service for that. And that is the role of Layman (https://github.com/LayerManager/layman), the publishing server that automatically converts geo-data into web services in OGC WMS and WFS standards. It provides an extensive REST API so any other possible client can be connected.
Metadata Catalogue
Any geo-data management system cannot work without metadata. Micka is the detailed metadata catalogue with INSPIRE standard support. All geodata published by our tools is automatically metadata-recorded. The metadata can be searched back through the HSLayers web client or the QGIS desktop tool.
Mobile support
HSLayers web application naturally supports mobile devices and is convenient to use. But that is not enough in today’s mobile world. That is why the mobile apps based on QField (https://qfield.org/) have been recently adopted in our solution pipeline. It is an exaggeration to say that it is a mobile QGIS, which also allows you to view published maps on your mobile phone and offers tools for data collection in the field. And all this can be extended according to your requirements. The possibility to easily publish maps also to the QField Cloud (https://qfield.cloud/) is a work in progress and will be available soon.
FINDINGS & CONCLUSION
Local Attractiveness
The attractiveness of territorial units (territorial attractiveness) is described as the diversity and complexity of many interrelated factors such as economic attributes (e.g. foreign investment), culture or tourism, innovation, social needs or population status. The definition and understanding of spatial attractiveness are highly dependent on the area used. Just as there are different perspectives on attractiveness, we encounter attractiveness solutions for different types of territories – from states to micro-level cities and towns (local attractiveness).
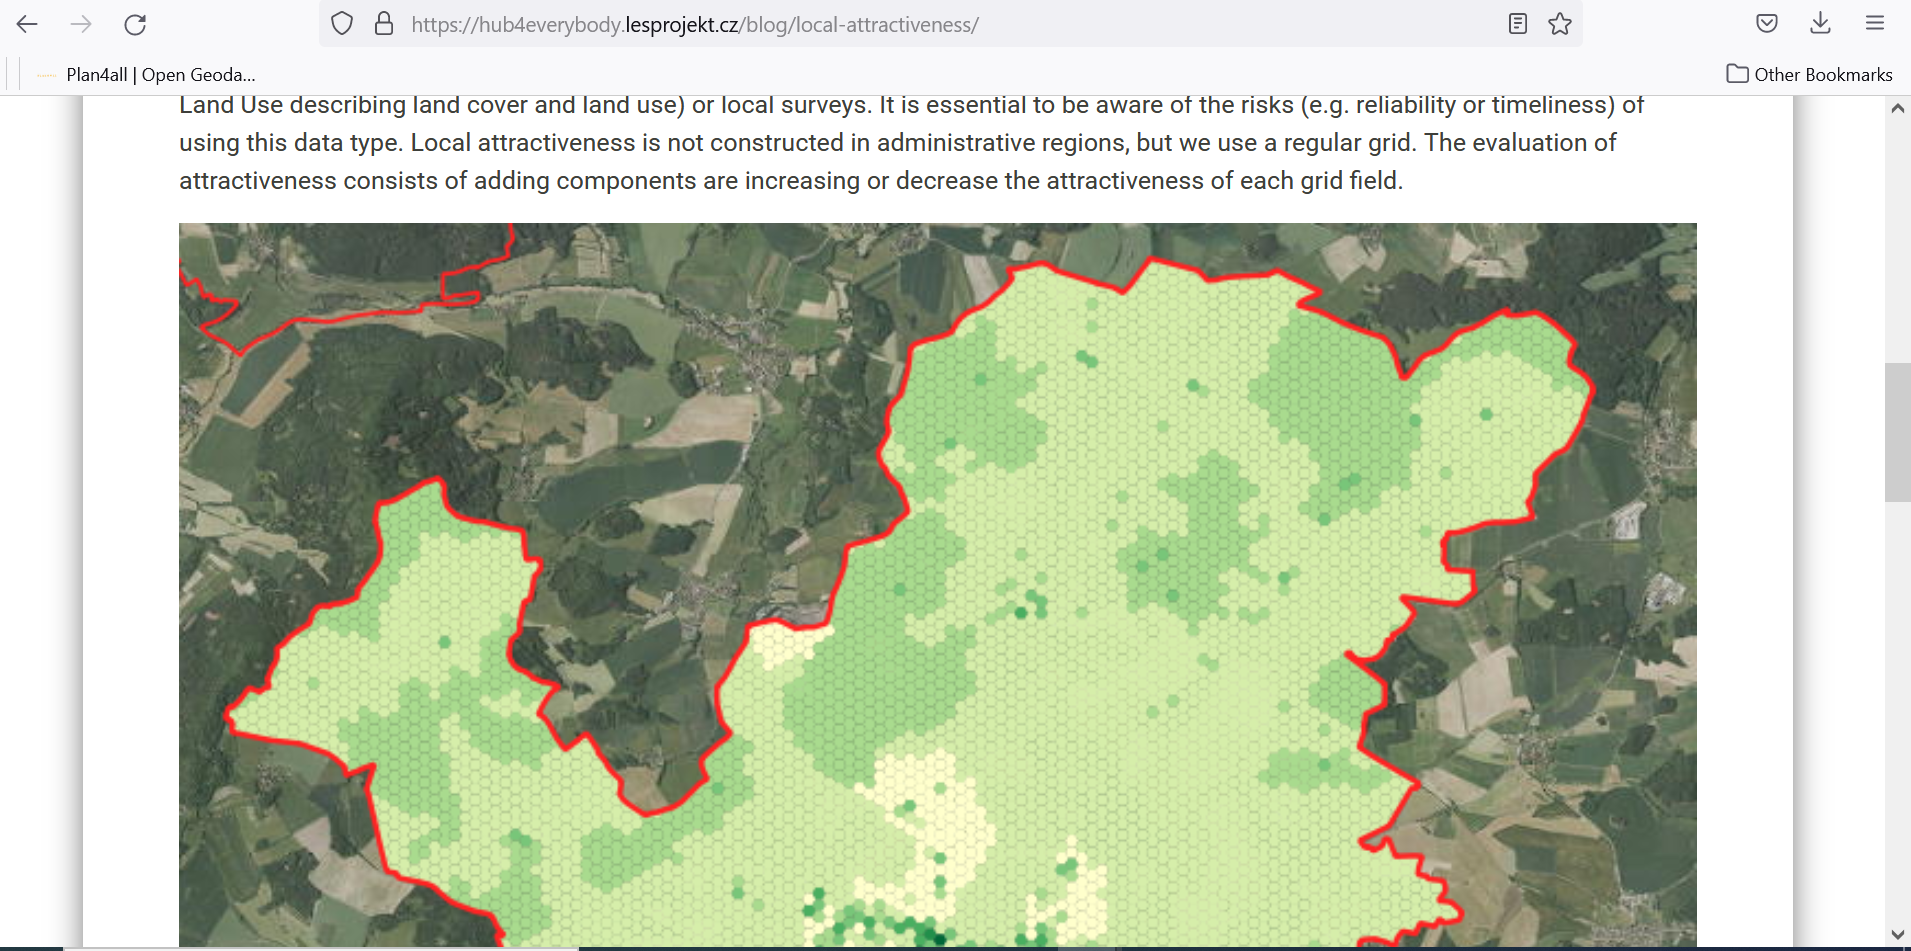
The main issue of local attractiveness lies in the possibility of adapting the data. The attractiveness of regions is based on official statistical data. However, such data are usually not available at the level of mini-municipalities. Therefore, it is necessary to find local datasets. There are several approaches to finding local data: point of interest data (OpenStreetMap, Smart Points of Interest), open datasets of land cover/land use data (CORINE Land Cover, Urban Atlas, Open Land Use) and local data (data collected by municipalities, citizens or local surveys). It is essential to be aware of the risks (e.g. reliability or timeliness) of using this data type. Local attractiveness is not constructed in administrative regions, but we use a regular grid (100 m hexagons). The evaluation of attractiveness consists of adding components to increase or decrease the attractiveness of each grid field.
The maps of the local attractiveness published on the Hub4Everybody are developed in QGIS software. Maps use the traditional red-yellow-green colour scale (red – areas, which are not attractive; green – the most attractive localities). The published maps show attractiveness in two small towns in south-west Bohemia: Klatovy (Figure 5) and Sušice (Figure 6).
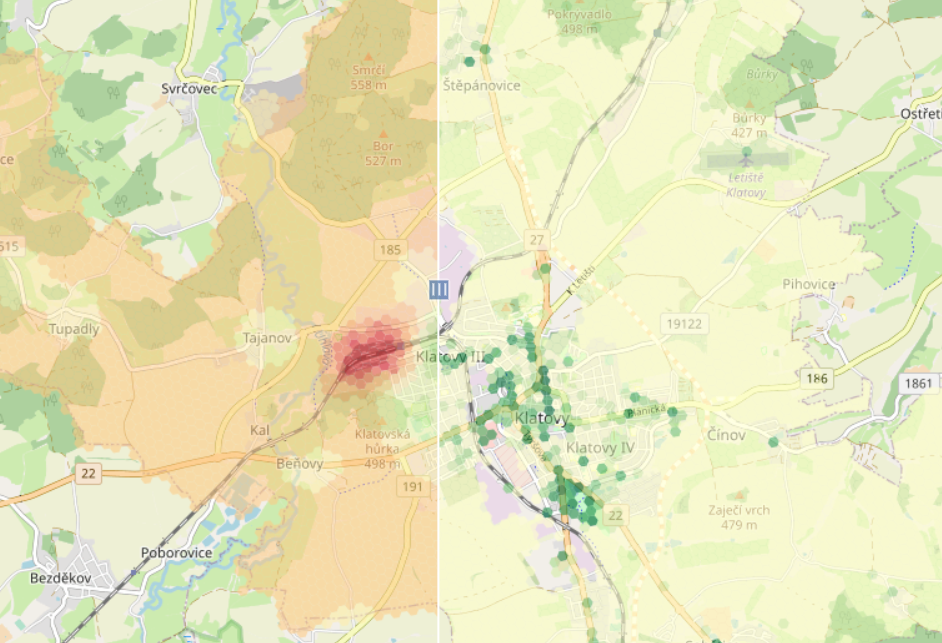
Figure 5. Two types of local Attractiveness of Klatovy.
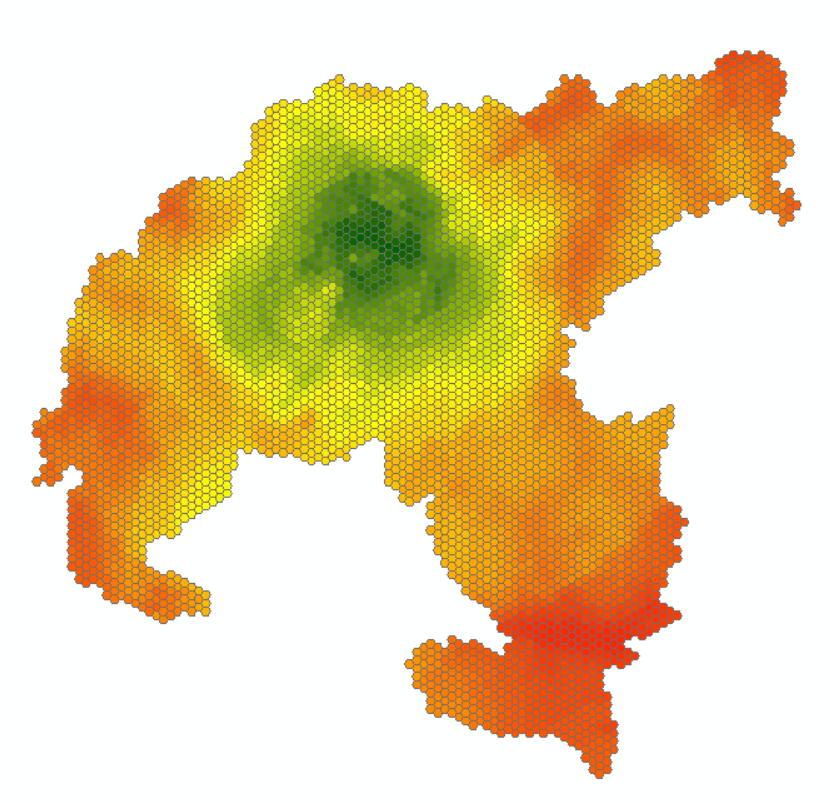
Figure 6. Local Attractiveness of Sušice.
Using the QGIS publication line from the Hub4Everybody solution data from attractiveness was published on the cloud> In the next step full potential of Hub4Everybody was used, publishing information about this experiment on Blog. https://hub4everybody.lesprojekt.cz/blog/local-attractiveness/
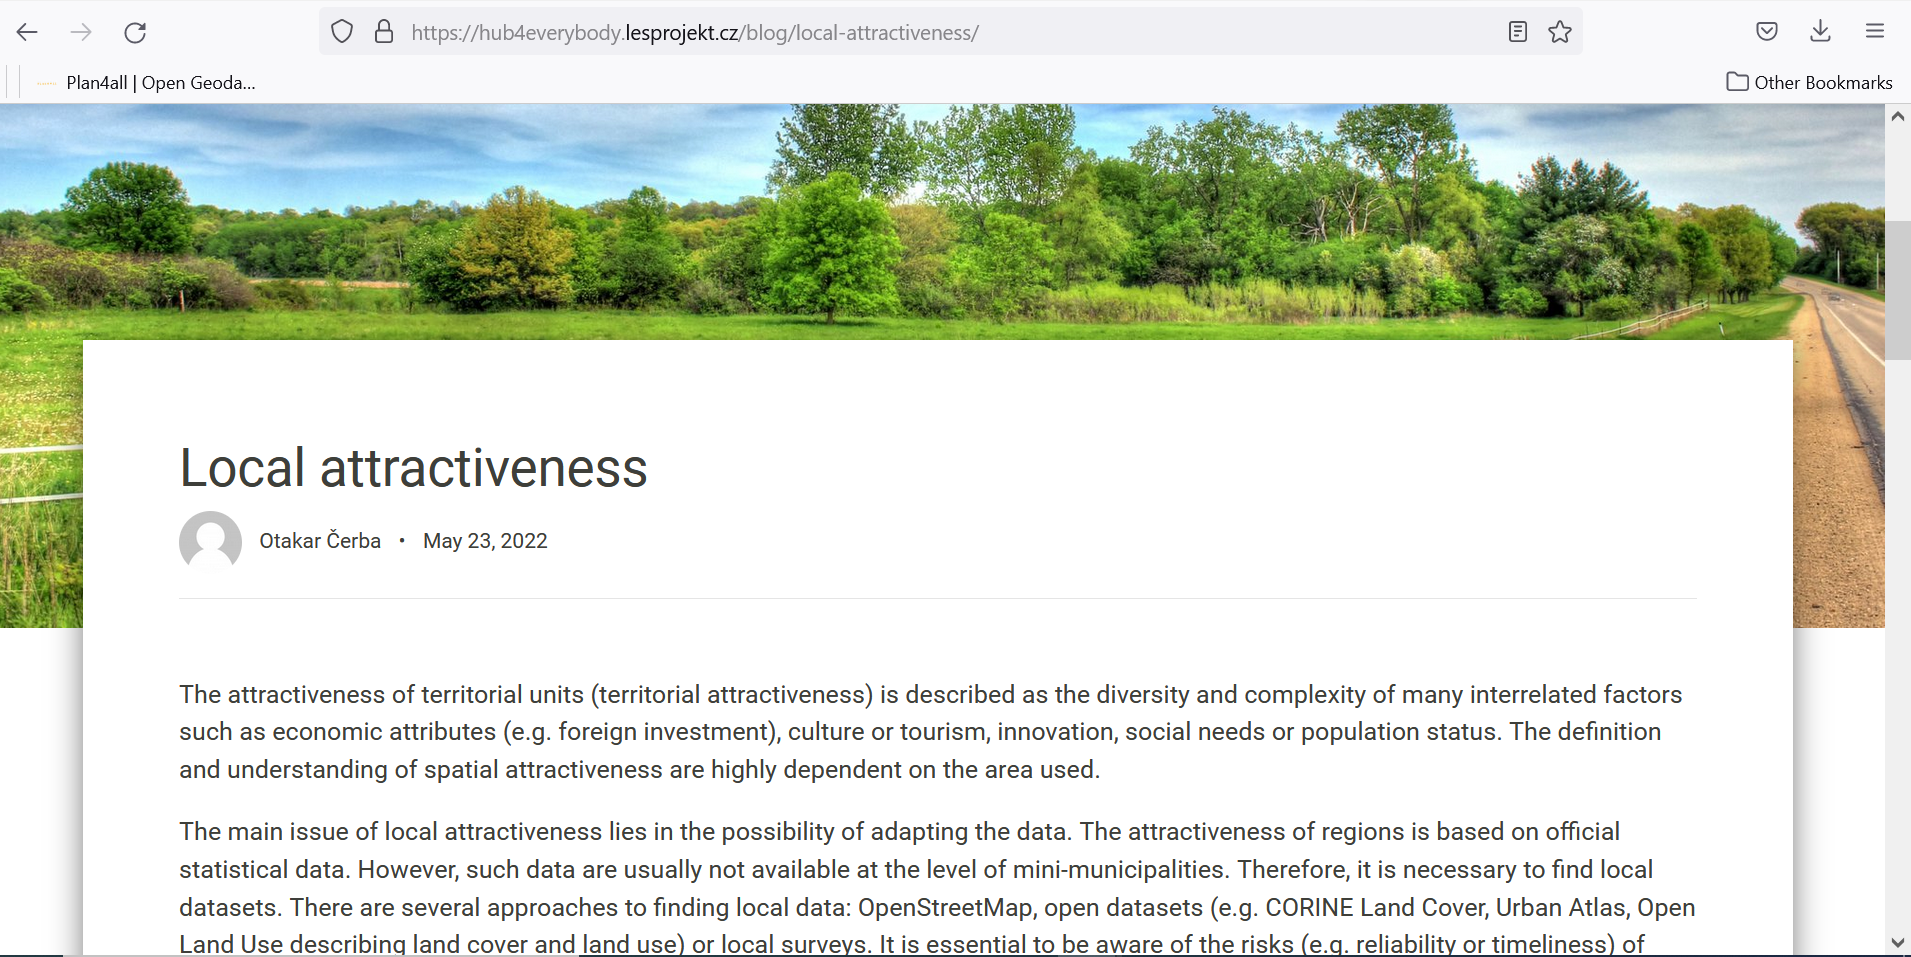
This demonstrates how Hub4everybody can be used for educational and awareness purposes.
Other experiments
Two demonstrating possibilities of existing solution results from other AgriHub INSPIRE Hackathon were integrated into Hub4Everybody.
Common results of #8: How to use and improve OLU 2.0, #7: OLU4Africa
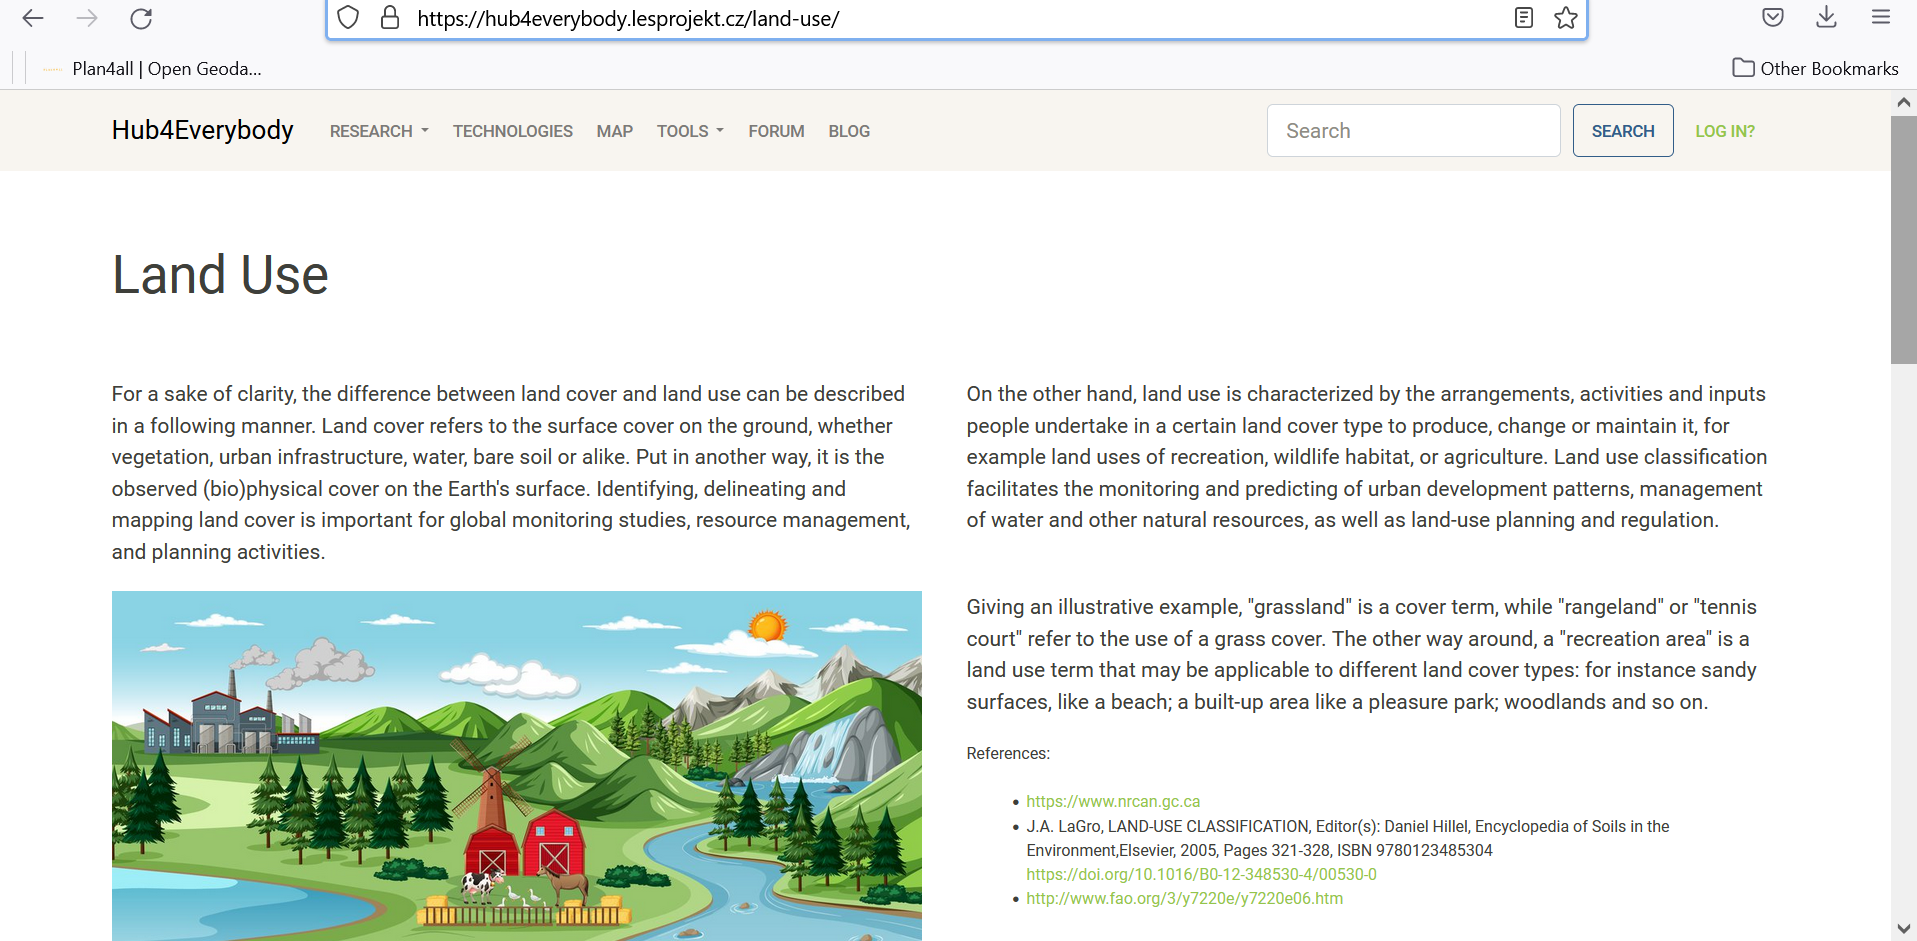
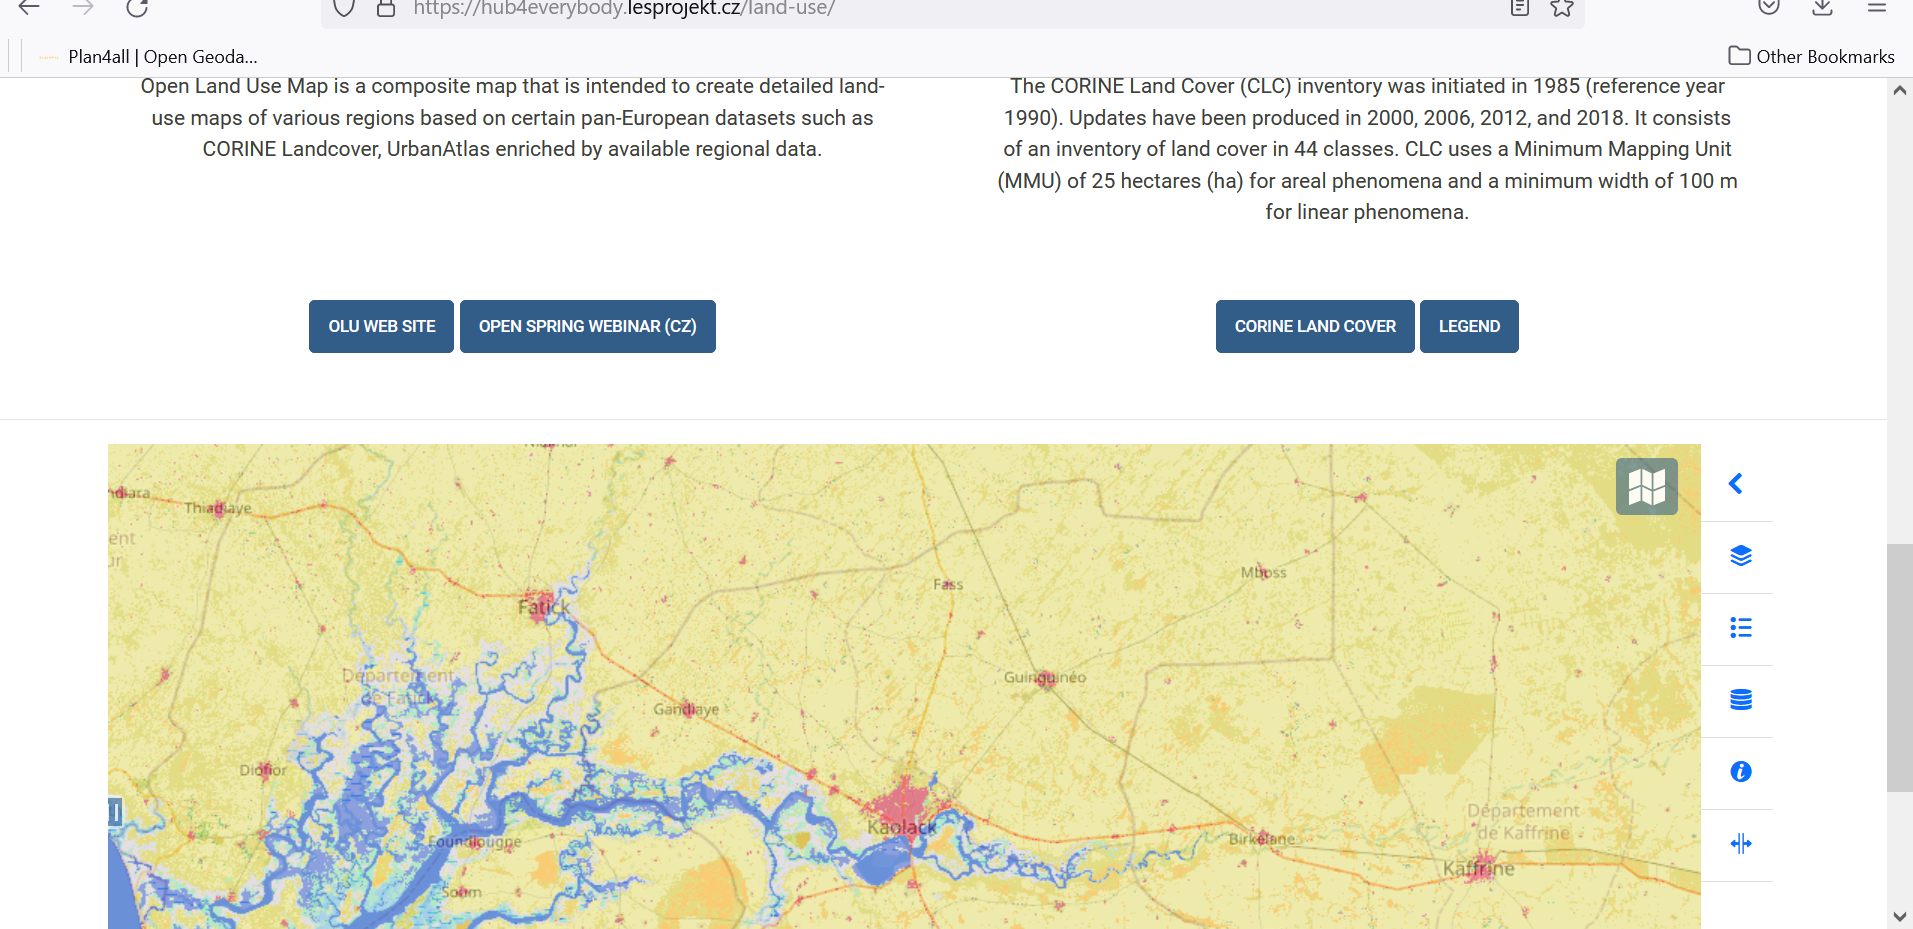
In the Research Part the web page describing OpenLandUse solution was prepared: https://hub4everybody.lesprojekt.cz/land-use/.
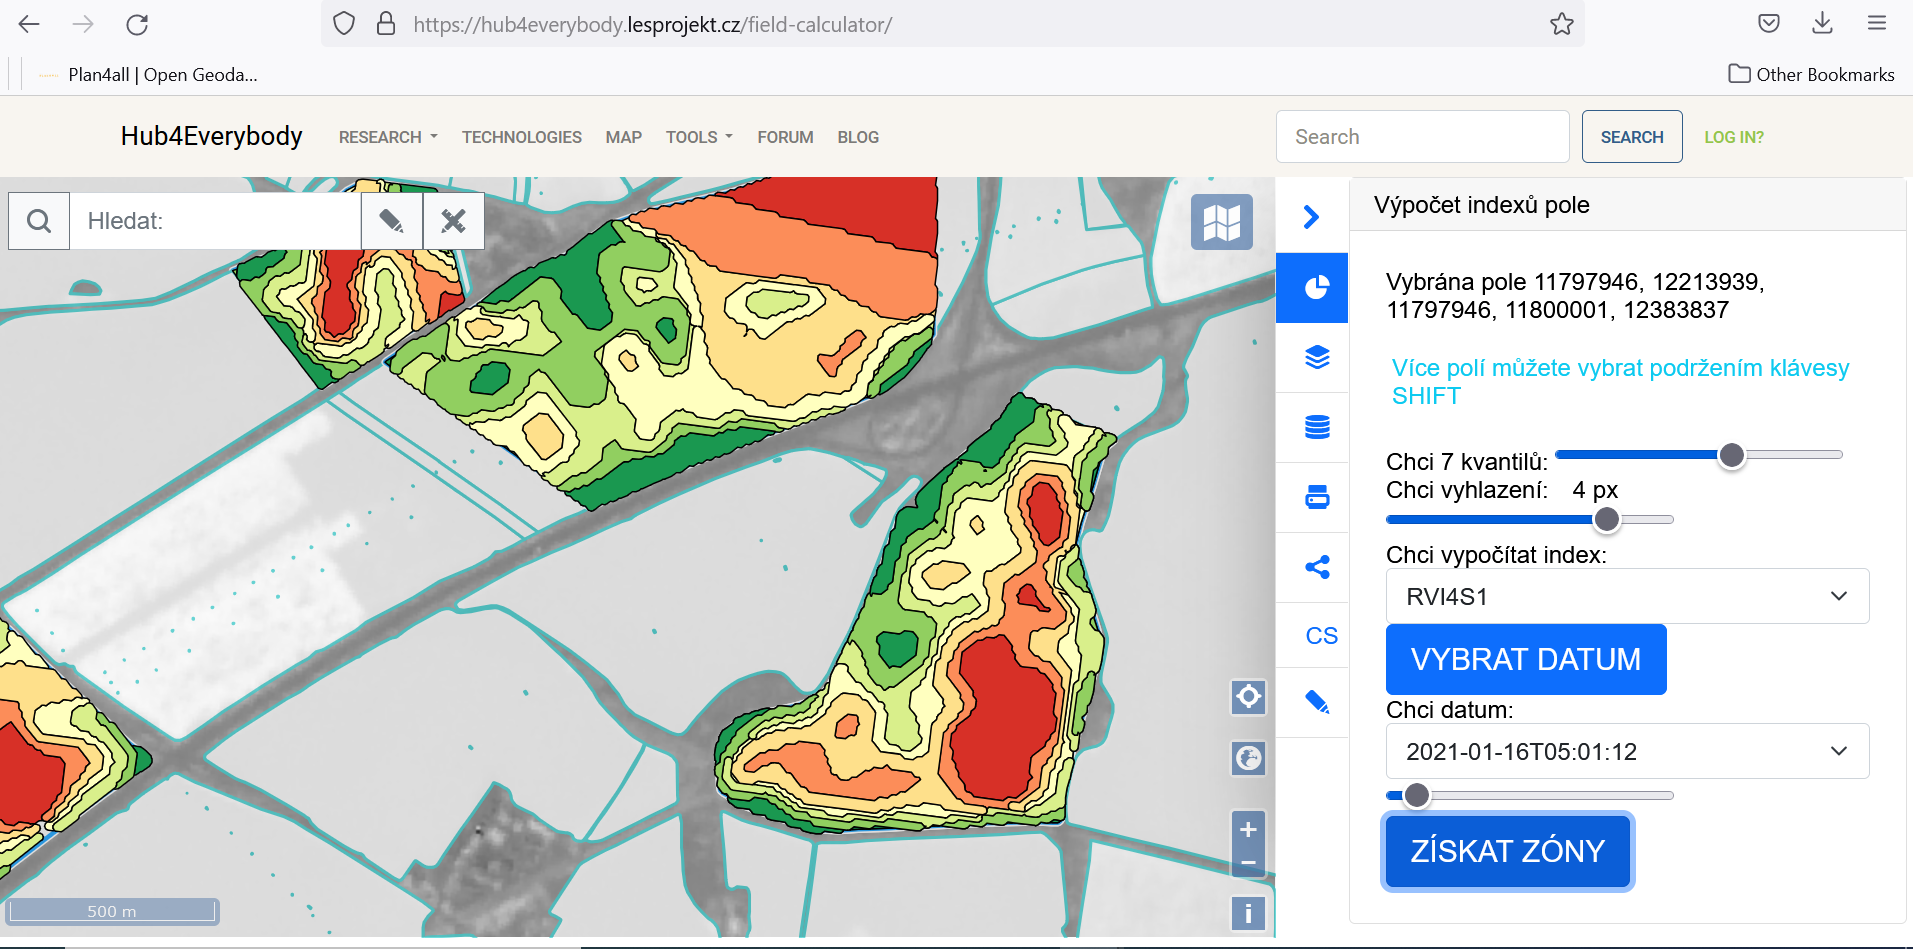
FINAL REPORT ON CHALLENGE #11: Automatization of calculation of management zones based on Yield potential
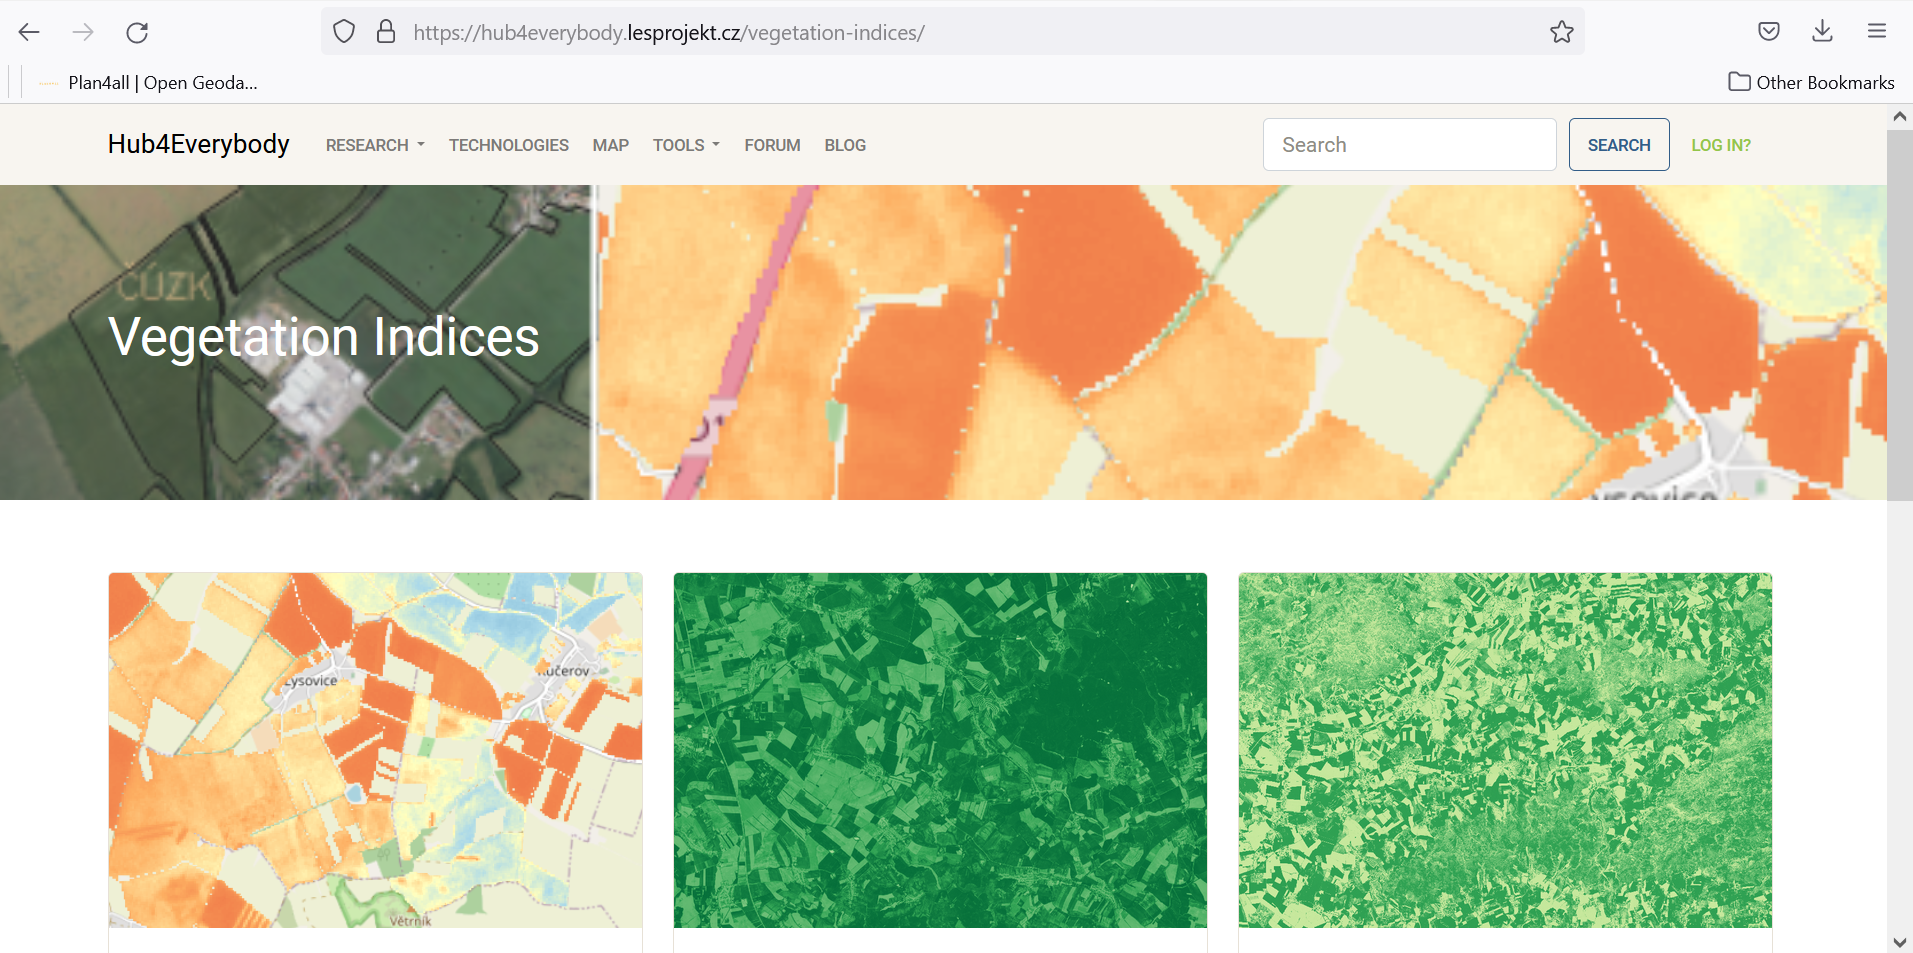
Together with Challenge 11 was prepared educational material about satellite indexes with interactive examples: https://hub4everybody.lesprojekt.cz/vegetation-indices/
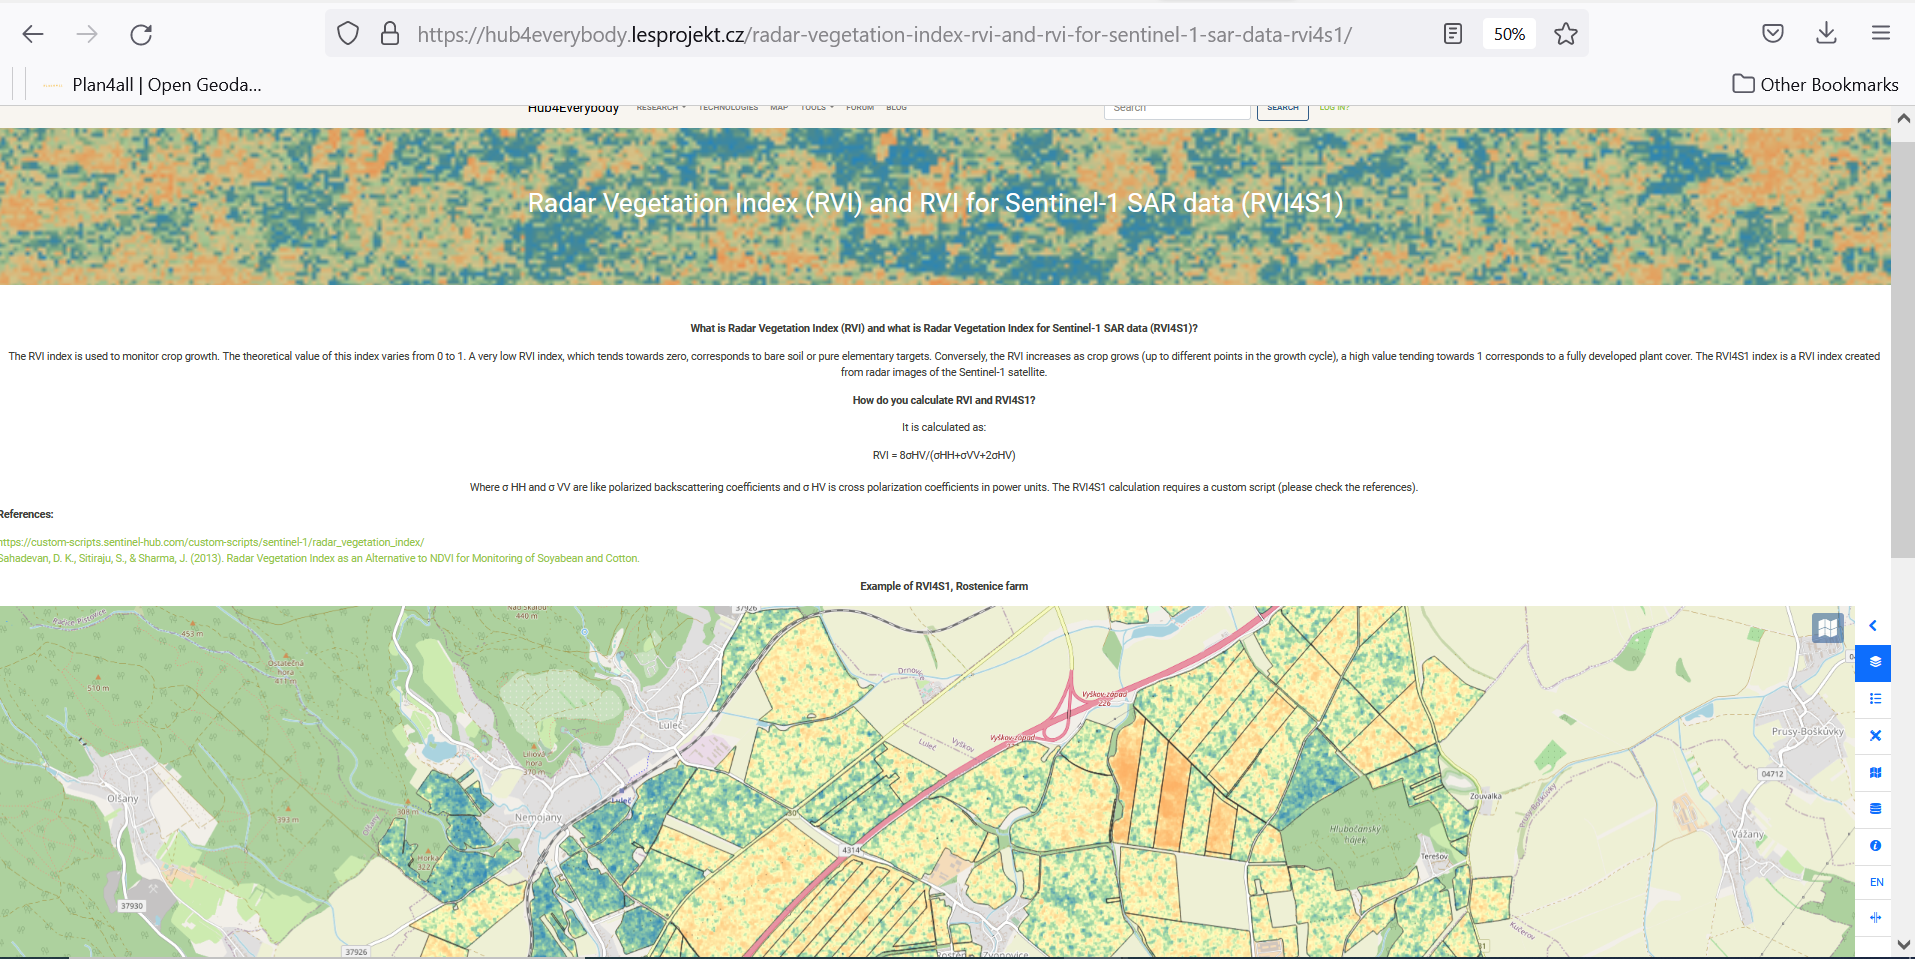
And also one of the outputs of this challenge – Filed calculator, providing automatic calculation of management zones from satellite data was integrated there.
was integrated
Both demonstrate the possibility of utilization of Hub4everybody for educational, training and testing purposes.
Findings and next steps
The realized experiments demonstrate large possibilities of utilization of these technological solutions for training, education, awareness but also for commercial purposes. The solution is more flexible and user friendly than the previous Liferay based solution. On the basis of this we started to build a strategy for extension of these solutions for internal and also for external purposes.
Internal purposes
- Integrate all web portals and Hubs of Plan4all under this platform. Plan4all has now two independent platform WordPress Based Web Pages www.plan4all.eu/ and Lifery based Hub https://hub.plan4all.eu/home under this new solution. It will reduce maintenance cost and also increase visibility of Plan4all. The idea is, that this will serve as an open space for all communities and everybody, who will be registered will be able to publish its achievements as Open Data and free. We are seeking a way, how to automatically transfer existing content into this new solution.
- Transfer Hubs from Previous projects SIEUSOIL, PoliRural, SmartAgriHubs under this solution. This will again increase usability and will be easier for maintenance. Also here we are solving problems how to migrate existing content.
External purposes
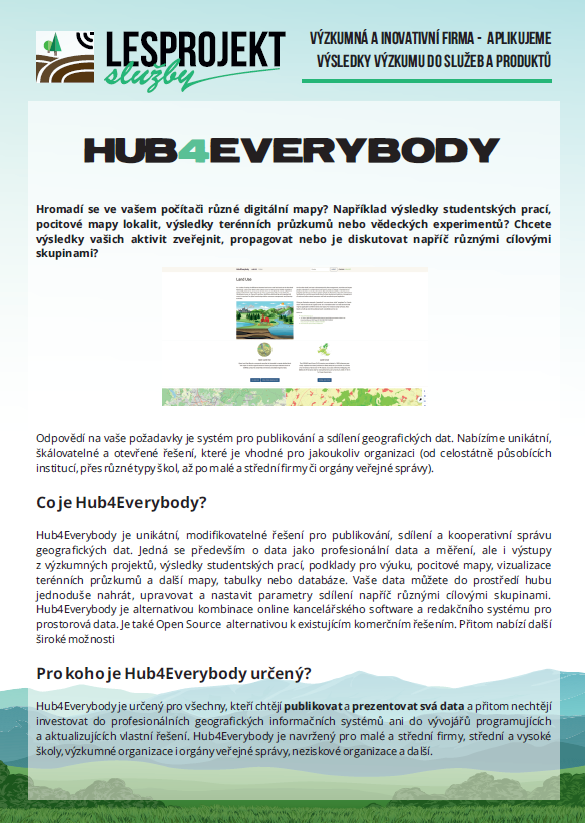
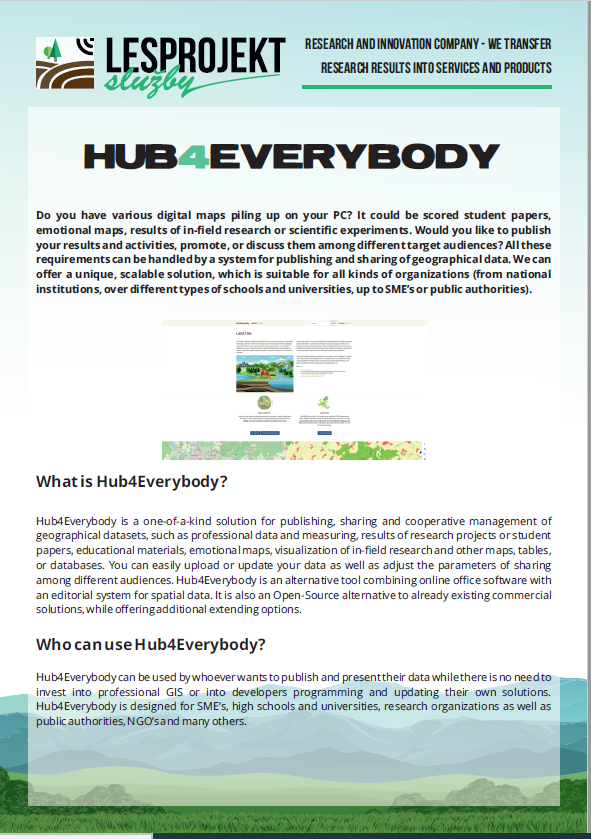
- To offer possibilities to replicate solutions for potential customers Universities, Research Organization , Small private companies, public organization. We can create or replicate this solution on the Lesprojekt cloud or we can implement this on user infrastructure as a virtual server. For this we prepared already promotional materials in English and in Czech.
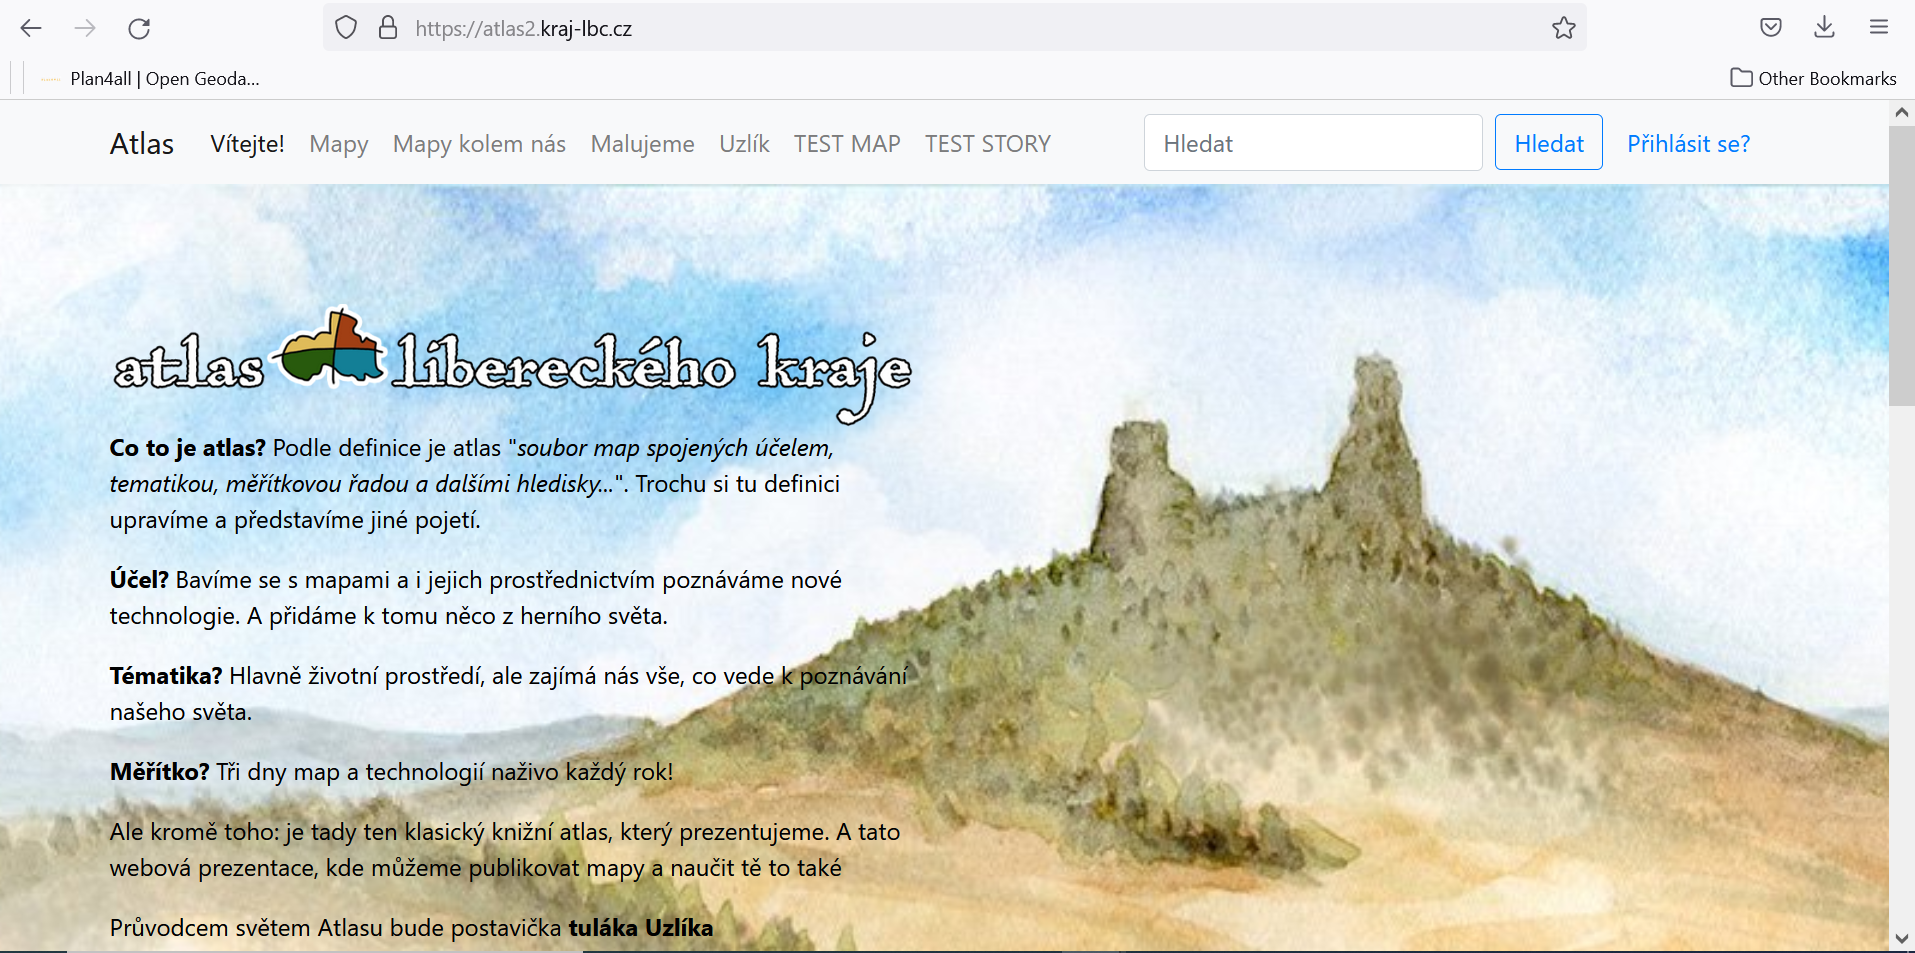
- Plan4all is, for a long time, cooperating with Liberec region on development of Environmental Atlas https://atlas.kraj-lbc.cz/home, which is educational and gaming environment.
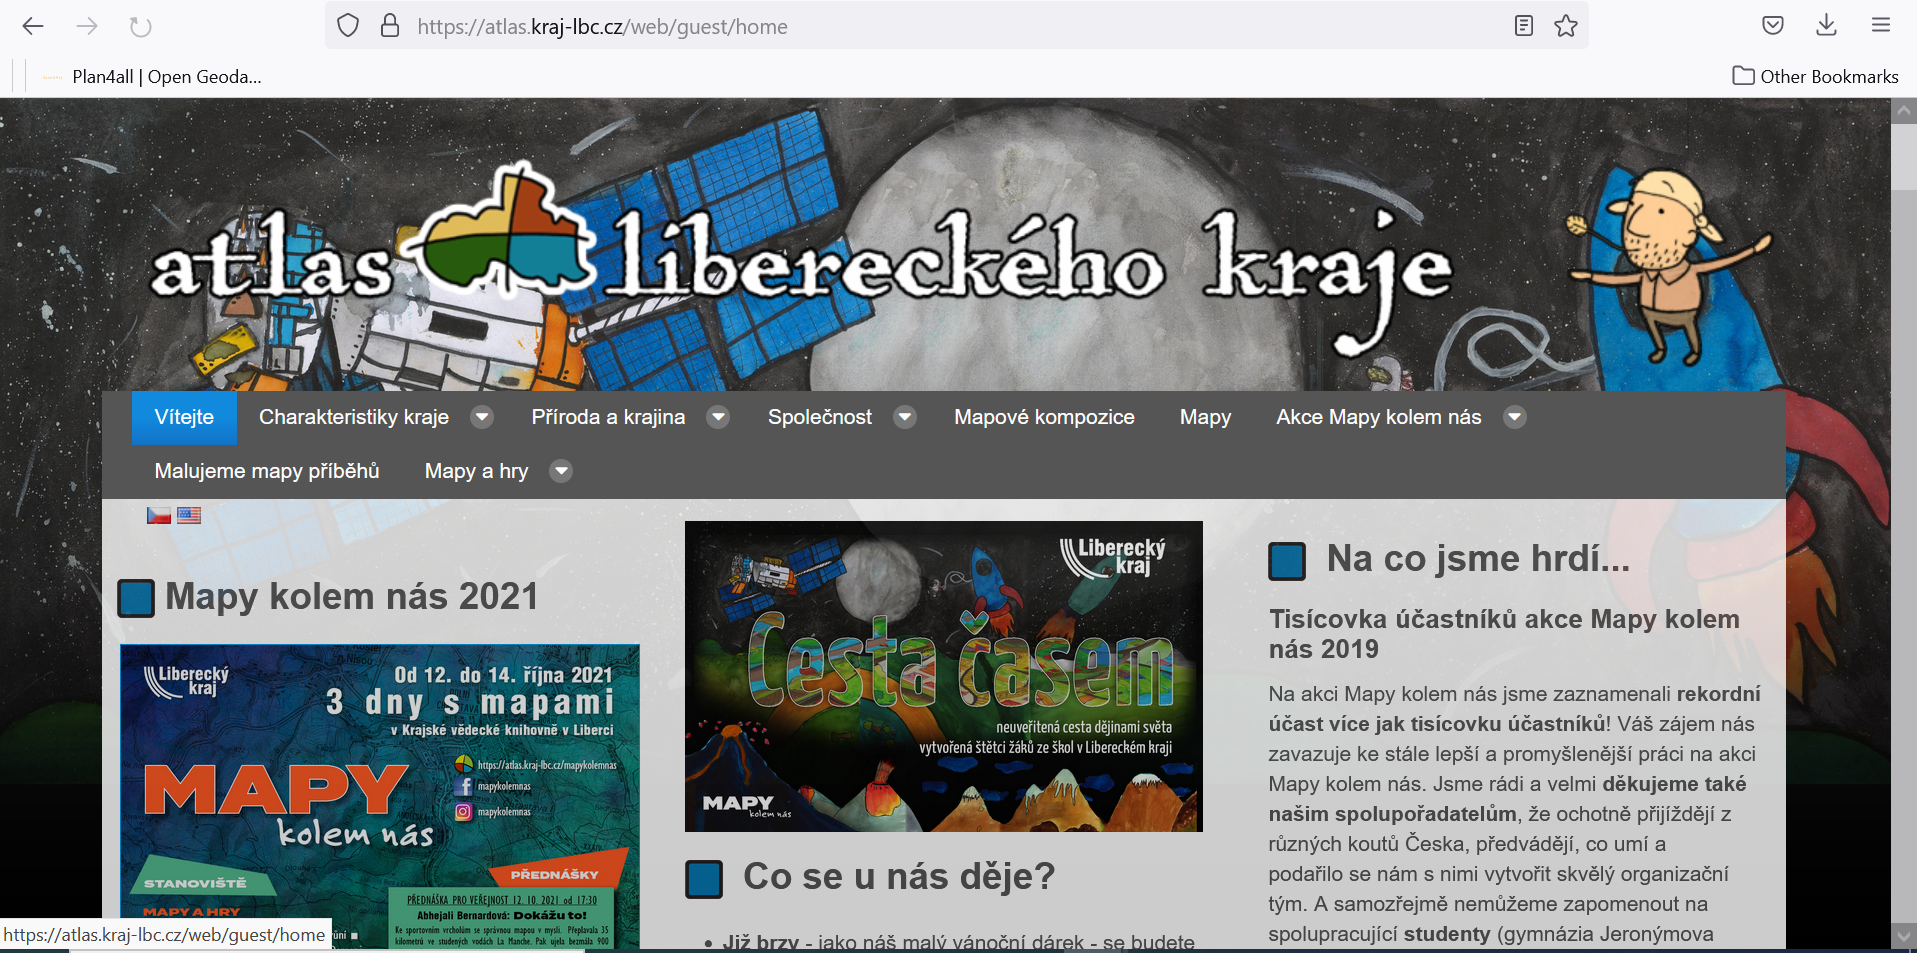
It was decided transfer this solution under new technology. The first steps and tests already started https://atlas2.kraj-lbc.cz/
In future is plan to transfer all data and information under department of Environment in Liberec Region under this new solution
Future Development
We have defined the next tasks for future development of Hub4everybody;
- Integrate MapWhiteBoard (Challenge 2 of AgriHub INSPIRE Hackathon) under Hub4everybody
- Integrate Dashboard (probably Grafana https://grafana.com/docs/grafana/latest/dashboards/) under Hub4Everybody
- Integrate Senslog part of AGRIHUB INSPIRE Hackathon Challenges #5: Analysis and visualization of sensor measurements and #6: IoT and EO data integration with Hub4Everybody