
FINAL REPORT ON CHALLENGE #1:
Further development and testing of the application
for creating variable rate application maps
Name of mentor(s): Karel Charvát jr.
Number of participants: 5
FINAL REPORT Challenge #1 Further development and testing of the application for creating application maps [PDF, 19MB]
INTRODUCTION
Background of the challenge
The goal of this challenge was to support further development of web-based application for preparation of variable rate application maps (FarmInsight), involve stakeholders in the design of the solution, test the solutions with large scale community, suggest further directions for the development of the web application based on the experience from challenge #1 and feedback from users, other stakeholders and developers.
Full explanation of the challenge defining the scope of the effort.
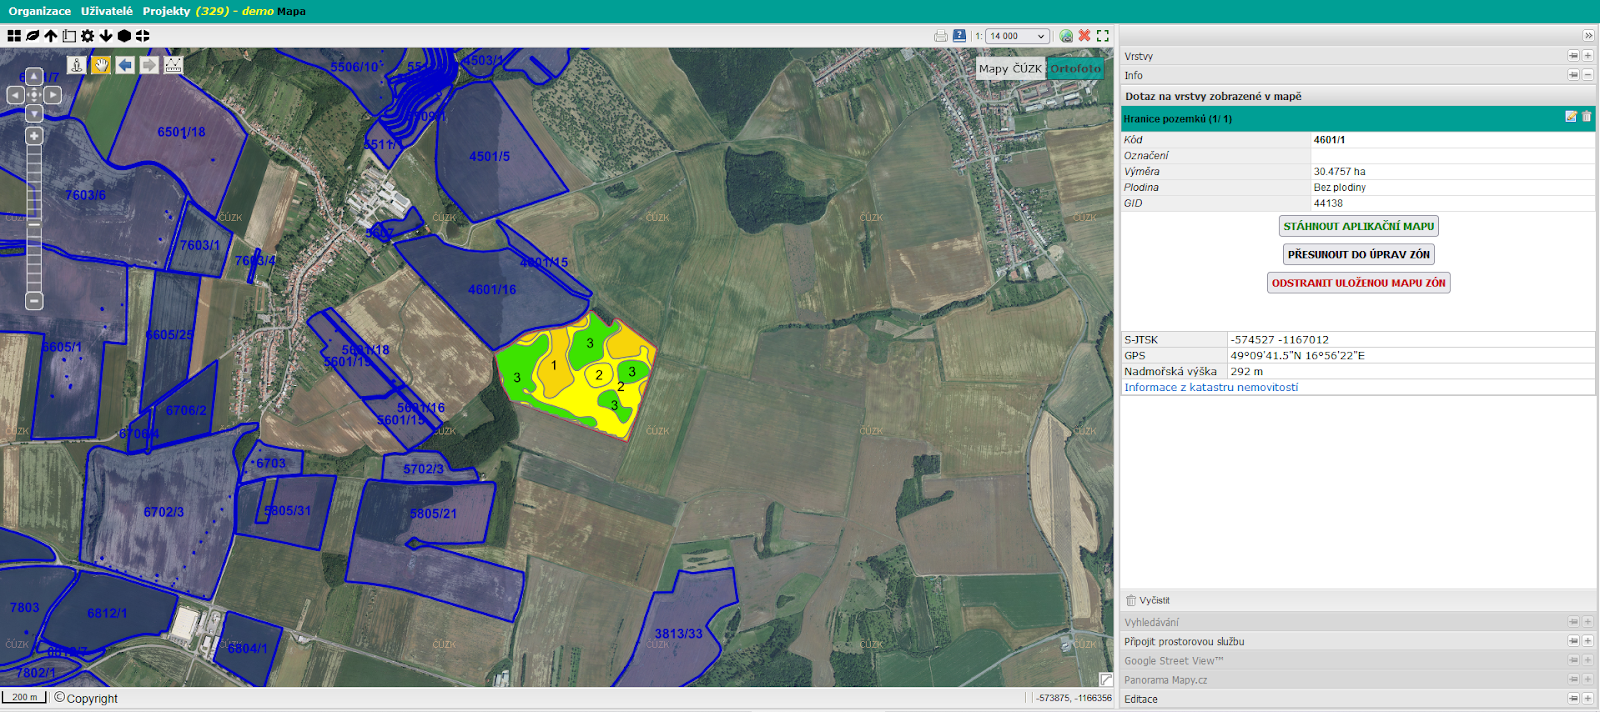
Variable rate fertilizer application (VRA) is one of the ways to reduce fertilizer consumption, increase the efficiency of fertilizer use and reduce the environmental burden. The method is based on monitoring the in-field variability of crop status or soil properties. This variability can be detected or estimated in various ways, and the result of this effort is the creation of a Management Zones map. Management Zone represents an area within the field where the same intensity of growing operation will be used. When we assign a fertilizer rate to each Management Zone within a field, we get a variable rate application map that is ready to be exported for use in agricultural machinery.
The web application that was the subject of this challenge uses yield potential (production zones) to define Management Zones and VRA maps. The yield potential is an estimate of the long-term yield variability within the field.
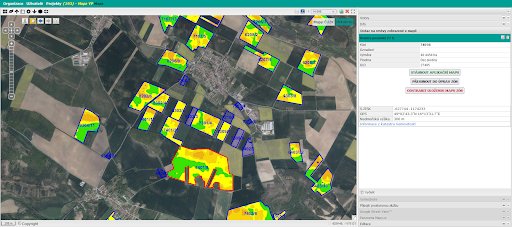
The web-base application (FarmInsight) allows farmers to manage their field data, manually plot an application map based on underlying data such as a rough yield potential map, or order a manually corrected Yield Potential calculation for selected fields and import them as Management Zones for the variable rate application map.
The goal of this challenge was to add new functionality into FarmInsight, to test solution in real environment, to promote the solution, create a stakeholder community, involve the stakeholders in the development and propose new features of the web application based on their feedback.
METHODOLOGY
Team description + info about any coordination with other organizations, outside agencies
The team was based on a multi actor approach and involved software developers,
agronomy and agriculture specialists and worked closely with farmers and also food
industry.
5 People participated directly in the management and development within the
challenge # 1: Karel Charvát jr, Karel Charvát, Vojtěch Lukas, Heřman Šnevajs and
Dmitrij Kožuch.
Two companies, Dolní Újezd farm and Asahi Breweries, provided feedback.
Challenge was presented on Webinar Remote Sensing Webinar with participation of 53 people and the video frim the webinar was watched by 59 people on Youtube till now
Challange was also presented on Mandolin Workshop with 20 atendents
We alse organised in situ meeting with Ashabi Beer and Farm Dolni Ujezd discussing the results and further development. The meeting involved with 9 participants
Challenge # 1 also closely cooperate with other challenges of AgriHub INSPIRE Hackathon, namely Challenge #11 Automating the calculation of management zones based on yield potential and Challenge #9 A new social space for geographic information sharing and education
Technical Background
Existing functionality of FarmInsigh
The existing functionality of FarmInsight was mainly focused on the preparation of VRA maps based on estimated long-term relative yield variability within a selected field and management of the data necessary for the preparation of these maps.
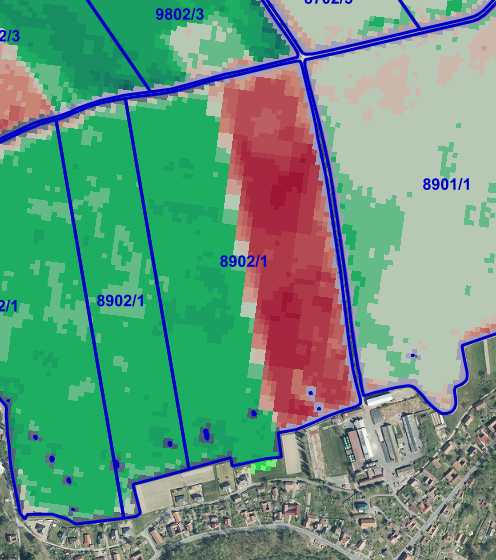
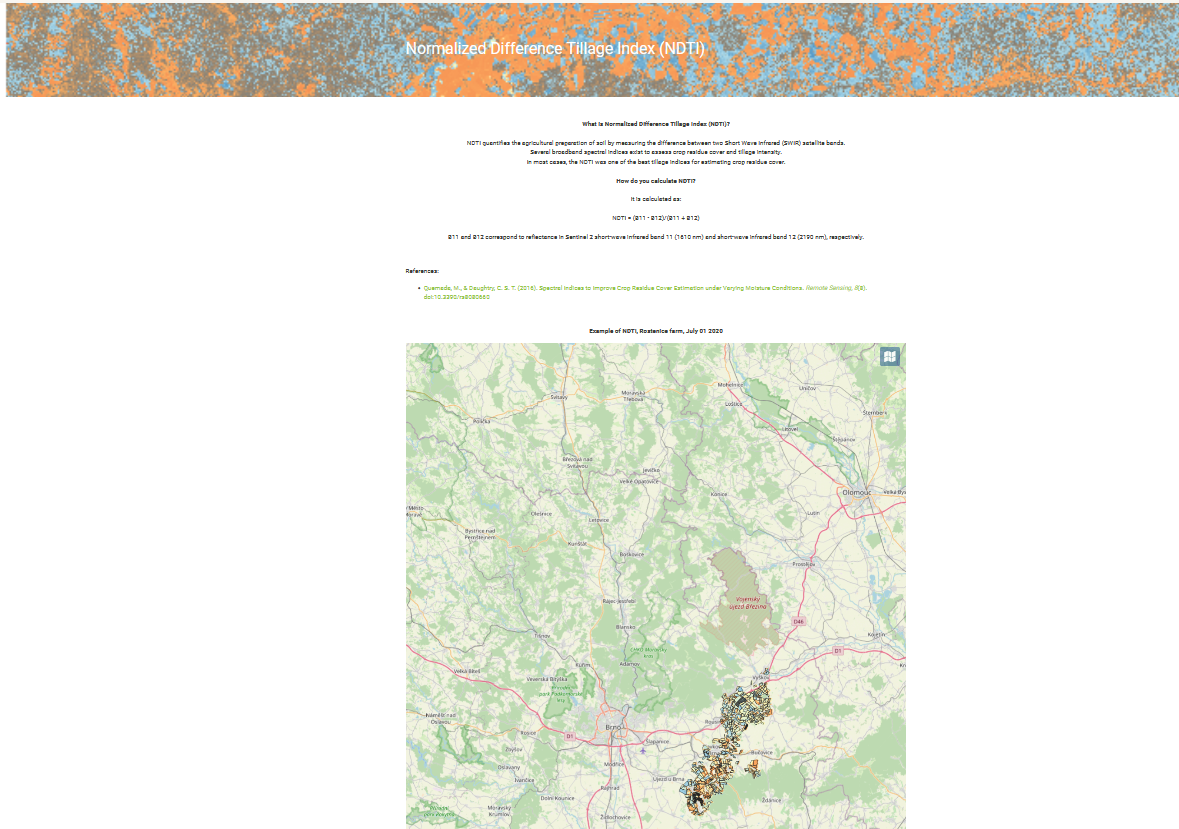
The analysis of long-term relative yield variability in different parts of the field helps the agronomist to identify zones in the field where below-average, average and above-average yields are achieved over an 8-year horizon. The yield variability is estimated by monitoring the crop status during the growing season (May, June) based on the EVI index.
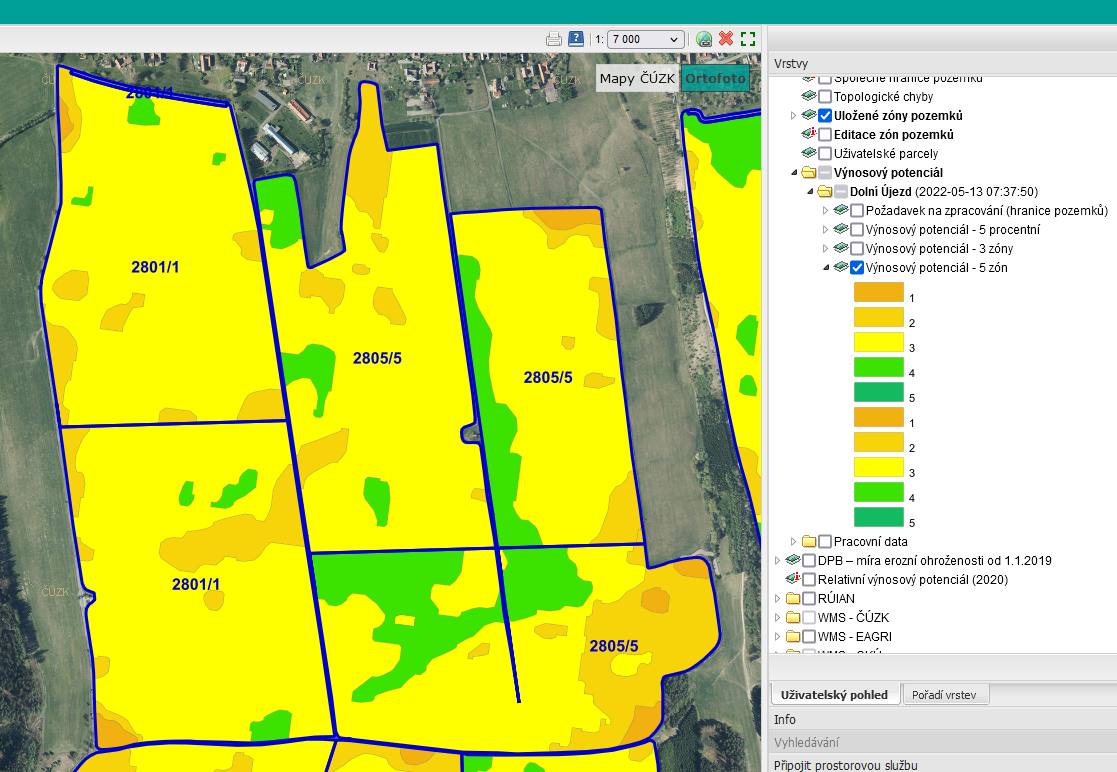
Observed variability can be classified into 5% zones, where the value in each zone expresses the percentage by which the yield in that zone varies relative to the average yield of the field and classification into 3 or 5 categories is used for the preparation of VRA maps.
Currently, the process of preparing management zones for application maps is not fully automated because not all relevant factors can be easily detected from remote sensing data, and in some cases the specialists performing the calculations need to verify and adjust the input data for some fields based on consultation with the farm agronomist who provides local knowledge of the field.
The need for analysis of current EO data
In addition to the relative yield variability, there are many other approaches for preparing VRA maps.
Some approaches focus on long-term yield variability, others monitor current crop
status, and some use completely different factors.
It is up to each agronomist to choose the approach that suits their needs.
Some agronomists use several different approaches and decide which one to use depending on the characteristics of the particular field and the operation they are planning.
In some approaches, the current crop status is the main factor or one of the factors taken into account.
In the further development of the Farminsight Application, we are focusing on adding more approaches that make use of remote sensing data, especially detection of the current crop status based on vegetation indices to give the user the option to choose which approach to the preparation of VRA maps to use.
Description of the process of the solution
The development was divided in three stages.
- Methodology development
- Server part and API implementation
- Integration of the solutions into FarmInsight using APIs.
Methodology development
The methodology was created in cooperation with other challenges and AgriHub CZ
SK innovation experiment. This experiments were performed mainly on local
computers using QGIS software, GRASS and other tools. For verification,
experimental data were published using cloud solution Hub4everybody to enable
discussion about the results by all interested communities. When results were
accepted by the communities, we started with server-side implementation.
Server part and API implementation
Server-side implementation was realized on Lesprojekt cloud mainly using Phyton
language and Lesprojekt cloud infrastructure. APIs and endpoints used for testing
and integration in warious applications and were dedined together withe the main
functionality.
Integration through API with FarmInsight
Last stage of development is integration of new functionality into FarmInight and
testing of the full line through FarmInsight application. Currently the new functionality
is already being tested by farmers.
Data Used
The original functionality of FarmInsight (before challange #1) already included tools
for managing farm field data, which is used as one of the inputs to the yield potential
calculation.
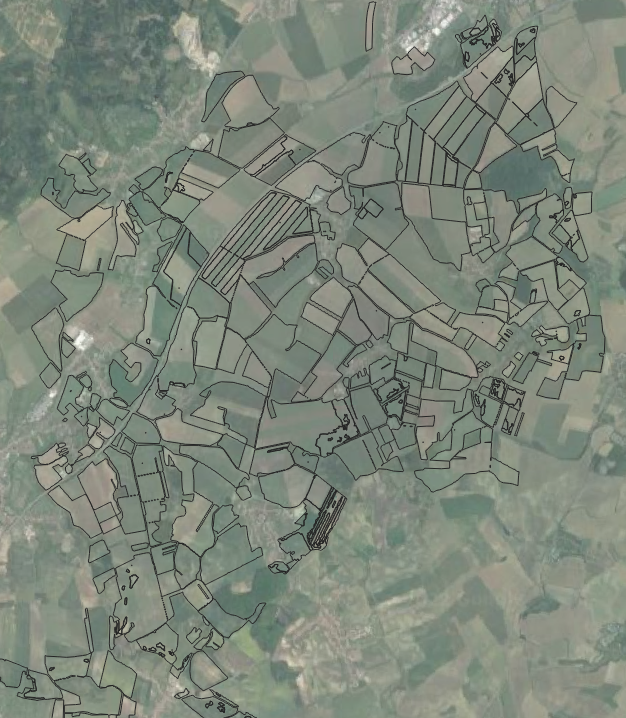
Field data including field boundaries usually comes from LPIS (Land Parcel
Identification System) and is loaded into FarmInsight in one of the supported ways.
The boundaries of the selected field are one of the key inputs also for the automatic
zmanagements zone calculation service created under the Challenge #11.
The data used for the automatic calculation of management zones provided by the
service developed under Challenge #11 includes an EVI index layer calculated from
Sentinel 2 data.
Detailed implementation plan
Challenge #1 benefits from the progress made in Challenge #11, where the main
output is the automatic calculation of management zones from a vegetation index
layer.
Functionality for using the endpoints of the service for the automatic calculation of
management zones created under Challenge #11 has been added to the
FarmInsight application.)
It is using API and endpoints, which were described in Challenge #11
Implementation
The Challenge 1 implementation includes:
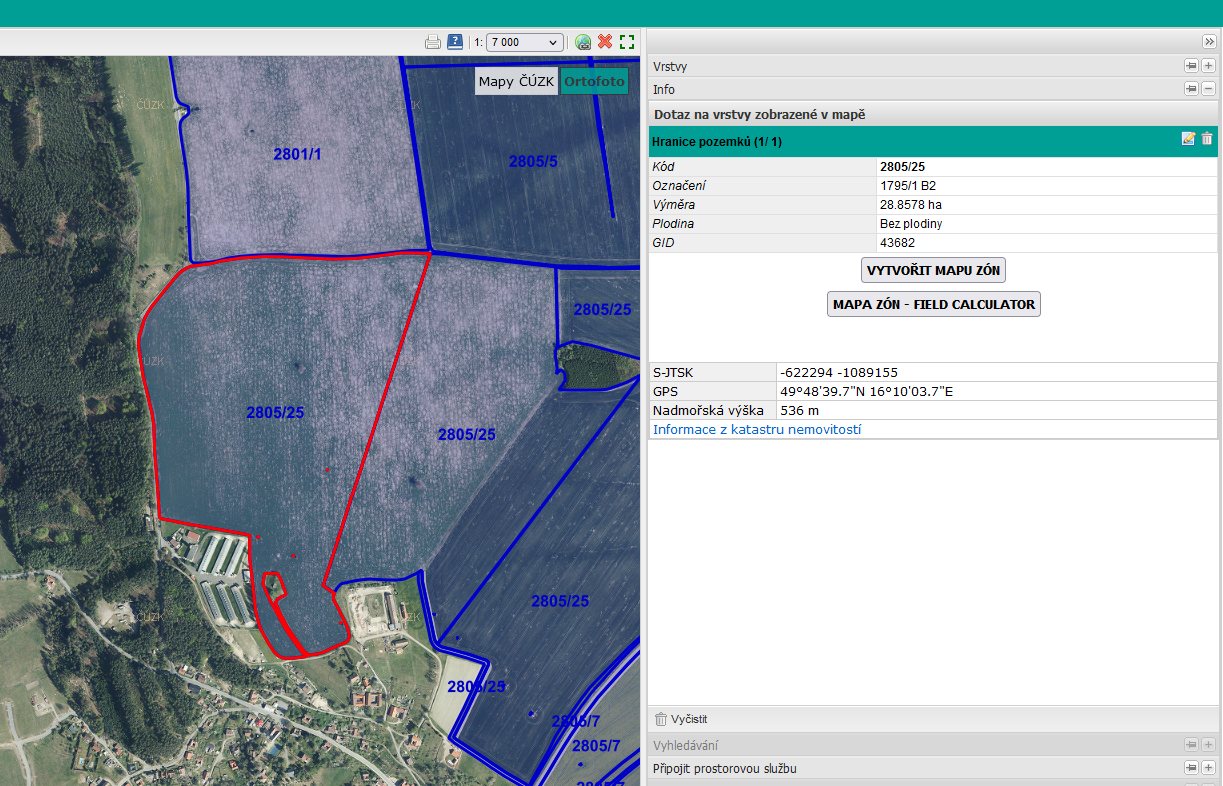
- dding several new elements to the FarmInsight user interface,
- automatically preparing the input data for use by the two endpoints created in Challenge #11,
- receiving and processing the results,
- storing the results in the FarmInsight data model,
- visualization of results.
The first of these Endpoints is used to get a list of available Sentinel 2-scenes for a
given location.
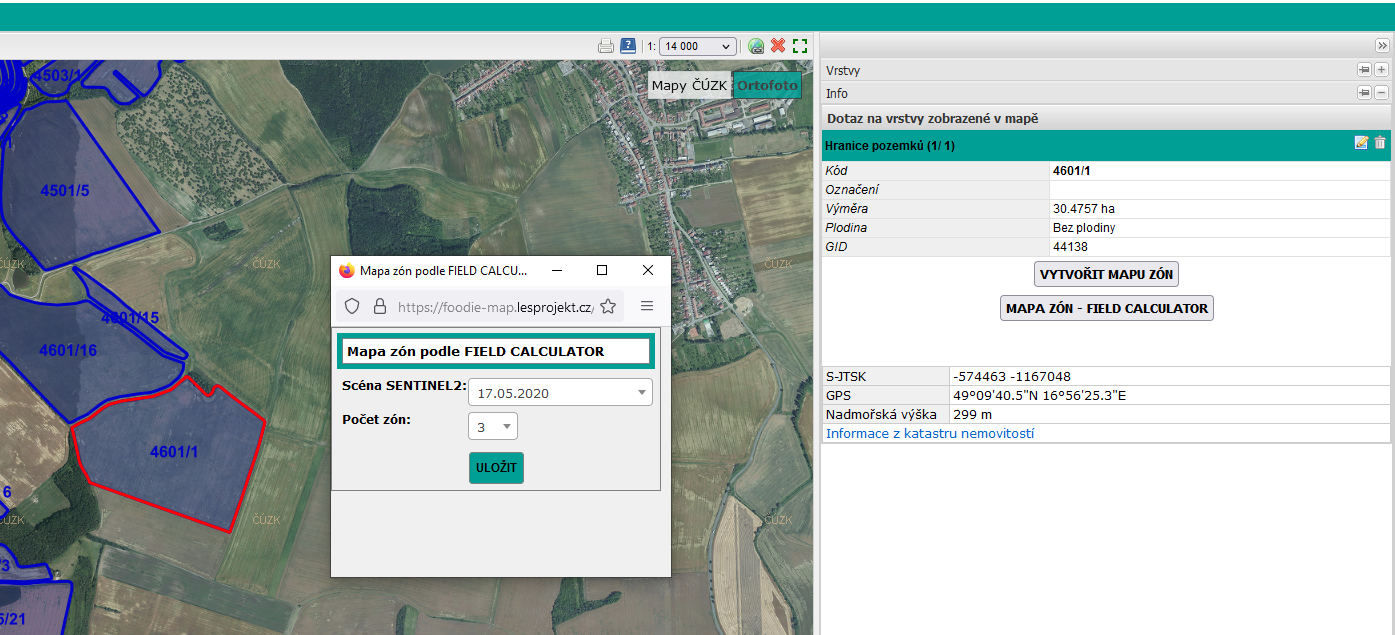
The second Endpoint is used to obtain automatically calculated management zones for the selected field based on the parameters provided.
A more detailed description of these end points can be found in the final report of
challenge #11.
Other experiments and developments related to challenge #1.
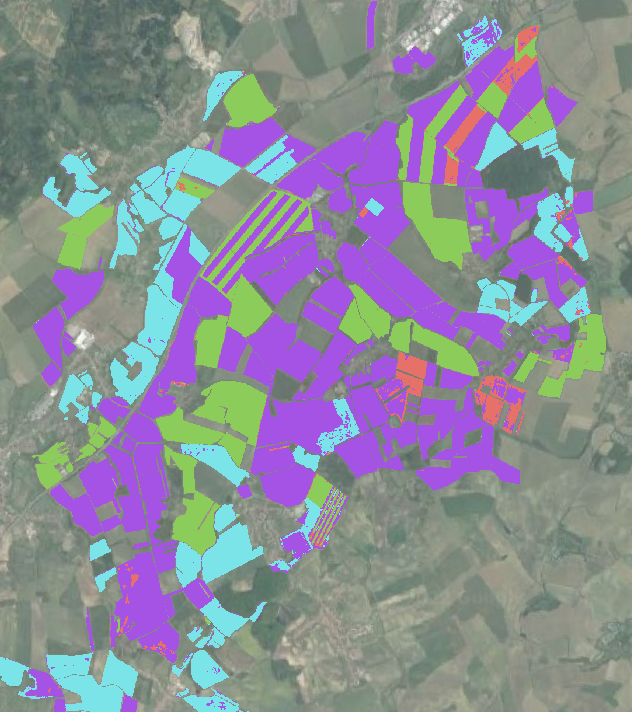
Needs for automatisation of division of the fields
One from the biggest problems for generation of Management zones using LPIS as
field boundaries is that data in LPIS often does not contain real information about
crop rotation and about division of fields to multiple crops, which is a fairly common
practice among farmers.
Parts of a field with different crops in one season may be incorrectly interpreted as
different yields.
Verification and adjustments of field data requires a large amount of manual work of the system operator and agriculture specialist. For this reason, we started together with Challenge 11 to develope a method for automatic update of LPIS boundaries from Sentinel data. This can dramatically increase effectiveness of the whole process and decrease cost of data processing.
The testing of automatic field boundaries detection, which was part of Challenge 11
is now being integrated into the process of verification and adjustment of data in
FarmInsight.
The full integration of this functionality will required more time and the integration processs is now directly linked with AgriHub CZ SH IE 1 Crop detection.
New indexes testing
Chalenge 1 benefits from cooperation with Challenge #11 Automating the calculation of management zones based on yield potential, where utilization of different indexes was tested for future analysis of current data.
The first results of the testing are available addressed on https://hub4everybody.lesprojekt.cz/vegetation-indices/. This is a part of educational activities of A new social space for geographic information sharing and education and it is planned that work will continue and will be extended.
This work is linked with AgriHub CZ SK IE 2 Crop Staus Monitoring
Building a repository for satellite data on Lesprojekt cloud
Lesprojekt is collaborating with several other organisations and work groups on developments and experiments using satellite data. The solution for satellite data management is not unified between these groups at the moment, which in some cases slows down data exchange, data referencing and development in general.
The experience of Challenge 1 has confirmed the need for a unified cloud solution to enable the storage, analysis, visualisation and publication of satellite data hosted on our infrastructure.
Analysis of needs of stakeholder groups
Community building and feedback
The important part of the hackathon was analysing the needs of stakeholders. promoing the solutios, providing traning for users, collecting feadback and preparing for future comemrcialisation of the results. During Hackathon three events were organized:
Remote Sensing Webinar
For Webinar there was 52 registered users
The video recording is on YouTube Remote Sensing Webinar and till now had 60 views
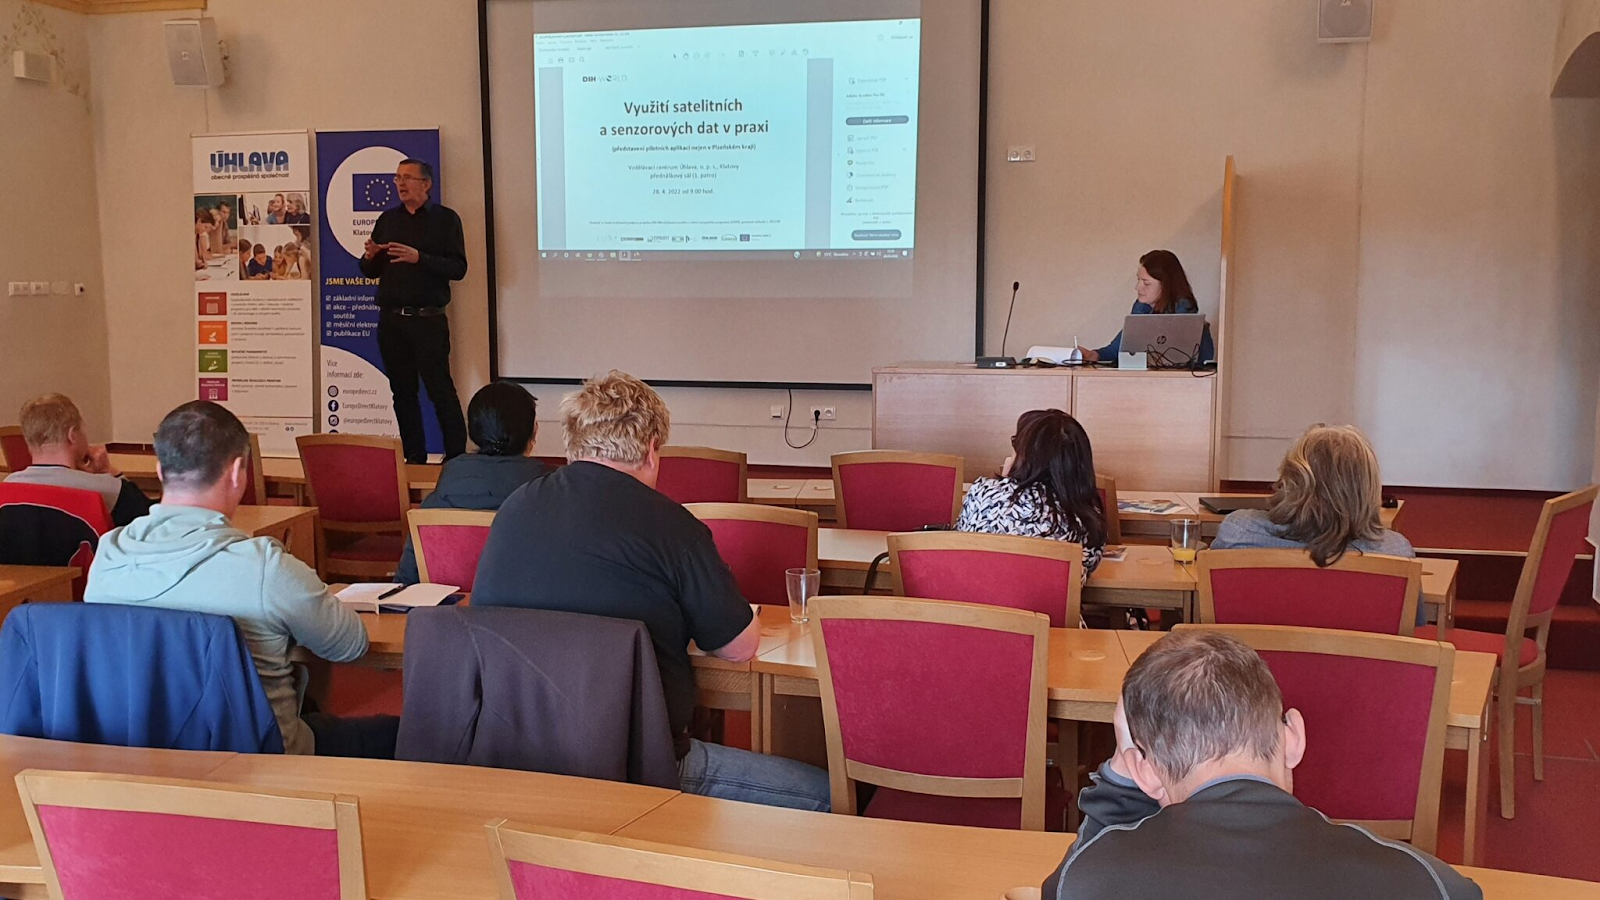
Mandolin workshop
Mandolin workshop was organized as part of Mandolin project (project funded under DIH Word initiative, which was prepared with assistance of AgriHub CZ SK)

Its aim was to present pilot applications in the field of satellite and sensor data,
Other co-organizers of the event were: Úhlava, o.p.s., EUROPE DIRECT KLATOVY, Plan4All, z. s., WirelessInfo, Lesprojekt-služby, Czech Open Solutions Center spol. s r.o., Západočeská univerzita v Plzni and Šumavaprodukt s. r. o.
Part of the worksop was also the presentation of FarmInsight and discussion with farmers and other stakeholders.
During this Meeting, we agreed with the representatives of Asahi Breweries to invite Dolní Újezd Farm, which is one of the malting barley producers, to participate in this experiment and further development, which can support malting barley producers to improve the efficiency and quality of their production.
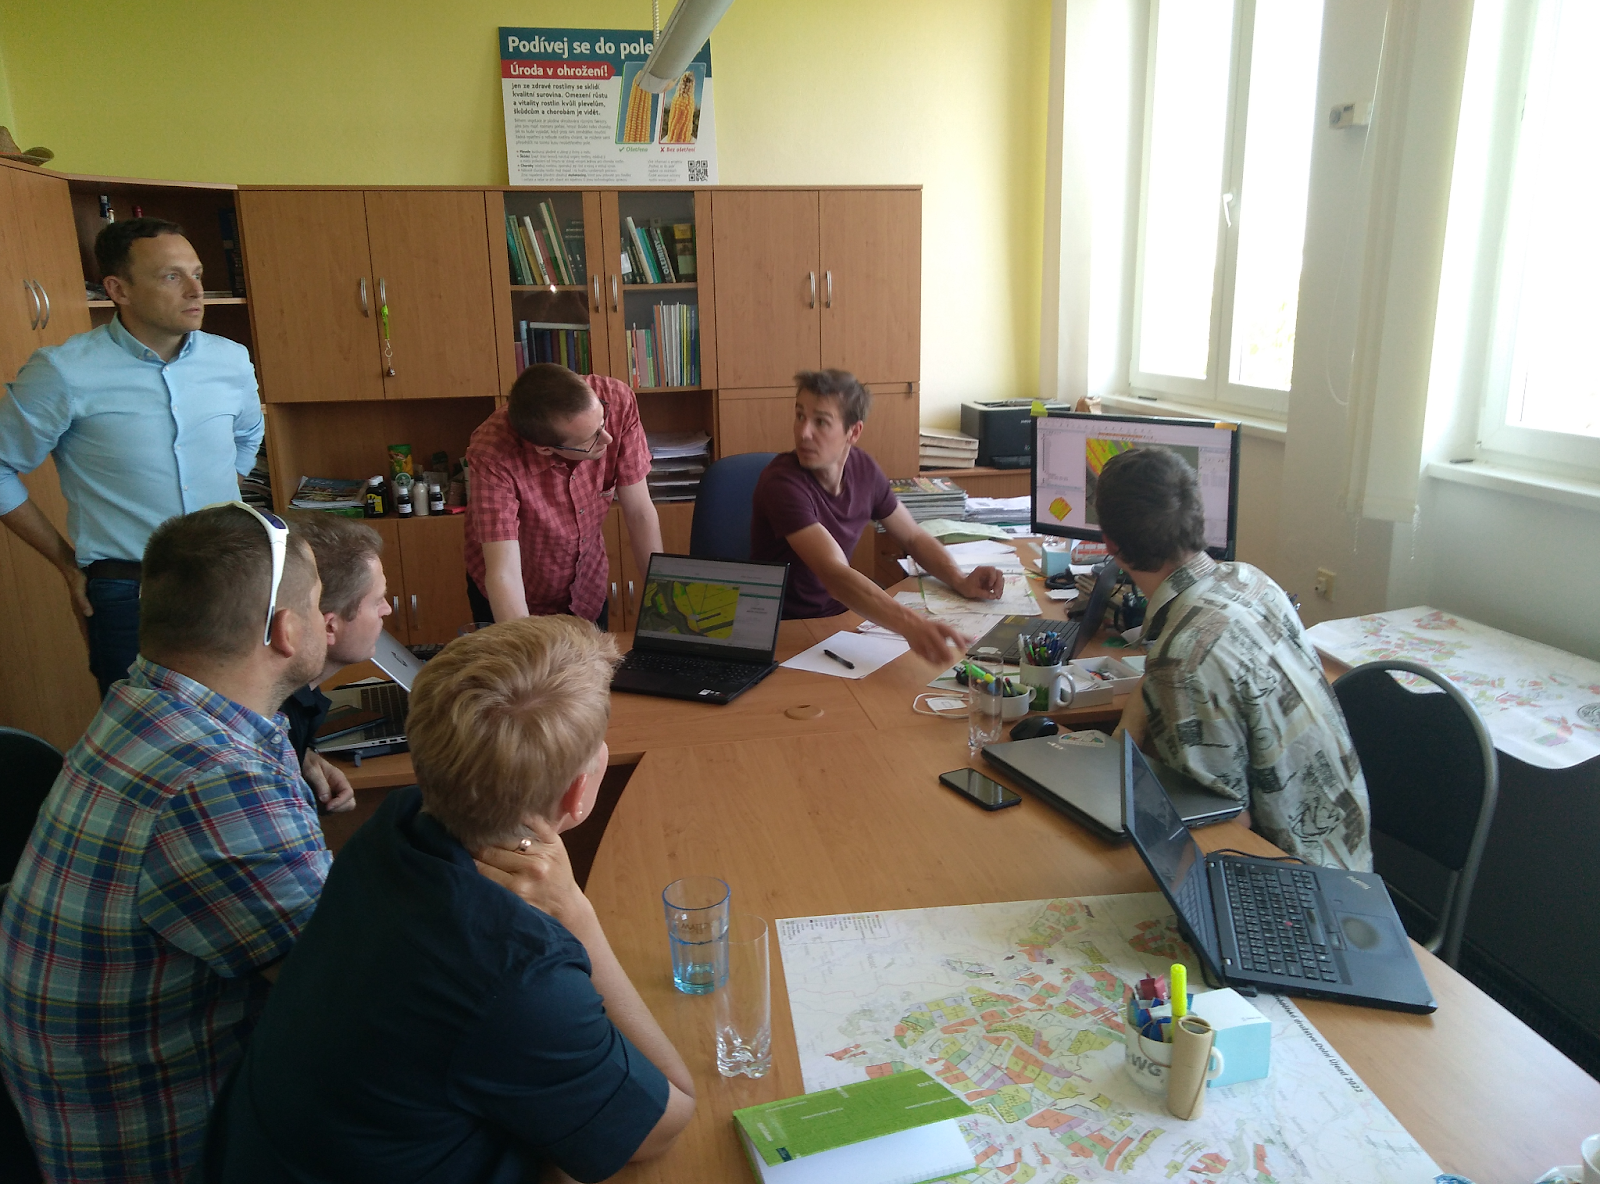
Meeting with ASAHI Breweries and Dolni Ujezd
Meeting with ASAHI beer in Dolni Ujezd was follow up of Mandolin meeting. The event was orgaised on 16th May 2022 with three representatives of ASAHI Beer, the main Agronomist of Dolni Ujezd, 4 representatives of Lesprojekt and one representative of Mendel University.
Lesprojekt representatives presented the results of their development and results of several analysis using satilite data and real data of Farm Dolní Újezda to representatives of Asahi and to the agronomis of Dolní Újezd.
Based on the main interests of the agronomist and the representatives of Asahi, we made agreements and plans about next steps, defined needs for improvements and further development.
One of the goals is to involve a set of demo farms as training centers for suppliers of malt barley. Asahi would like to support quality and sustainability of the production of their suppliers.
The main interest of the agronomist of the farm Dolní Újezd is to have available a wider range of analyses based on the use of satellite and sensor data, which will allow him to choose the appropriate method for a variable rate application, to have the possibility to adapt the choice of method to the field operation he intends to carry out and to have available methods that will support his decision-making on the timing of various fild interventions and treatments.
Experimental results
The first version of the automatic management zone calculation service developed under Challenge #11 has been successfully integrated into the FarmInsight Application. The group working on Challenge 1 provided feedback to the Challenge 11 group that led to several adjustments to the algorithm used in Challenge #11, resulting in a map where individual zones have smoother edges and there are fewer zones too small to be relevant in VRA maps. Further optimization of the algorithm and parameters used will be carried out in collaboration between challenge groups #1 and #11 after the end of this hackathon.
FINDINGS & CONCLUSION
Discussion of the results and findings
Discussion of the results led to the conclusion that the progress made under Challenge 1 is a valuable addition to the range of methods that can be used by farms and their agronomists.
The debate over the results of the analyses, where several specific fields of Dolní Újezd Farm served as examples, confirmed that there is no one-size-fits-all analytical method that is appropriate to support decision-making under all circumstances and for all fields, and that different approaches to meeting the needs of as many farms as possible need to be explored.
Further improvements
On the base of user feedback, next task for future development were defined:
- Integration of field division into automatic calculation of zones,
- Combination of current EO data with data about long term yield variability and designing methods that take both into account.
- Combination of satelite data with data collected online on machinery
- Integration of other data sources like yield maps, soil conductivity and other indexes
- Modification of the technology for the purposes of precision seedings and soil processing.