Dubrovnik INSPIRE Hackathon 2020 Winners

Dubrovnik INSPIRE Hackathon 2020 was terminated by a final presentation of results and awards ceremony during the INSPIRE 2020 Online conference. The jury members including Jitka Faugnerová (CENIA), Stefano Tamascelli (XTeam Software Solutions) and Alexander Kotsev (JRC) announced the following winners of the Dubrovnik INSPIRE Hackathon 2020:

Congratulations to all the winning teams and many thanks for excellent work to all participants!

Challenge #4: Traffic Modelling from web browser – use case of Františkovy Lázně

Team: Daniel Beran, Jan Blahník, Petr Trnka, Eva Podzimková, Zuzana Soukupová, Jan Sháněl, František Kolovský, Jan Šťastný, Jan Martolos a Karel Jedlička, supported by Polivisu and DUET H2020 projects.

The goal of our team is to demonstrate how interactive traffic modelling can improve traffic planning in any city. The demonstration consists of gathering available data and deploying a Traffic Modeller App of Františkovy Lázně (city of 5K people in Czechia).

Traffic Modeler (TraMod) is a tool for transport modeling developed in collaboration between traffic engineers, IT and GIS specialists. It can be fully implemented in a server environment with an application programming interface (API) for mobile and web applications. This creates an opportunity for a city or a region’s government representatives to test various traffic scenarios within seconds without a need to install and learn how to use desktop traffic modelling software or contacting traffic engineers every time a new roadwork appears in the region.

Our workflow for Dubrovnik Hackathon is as follows:

  • gather sufficient data about traffic network and about simulated traffic generators,
  • calculate the traffic model and import it into a spatial database, where it can be accessed by our traffic modeler.
  • this model will then be used for modeling specific traffic scenarios via traffic modeler’s Application Programming Interface (API) (see the image below)

The final step is to develop a web Graphical User Interface (GUI) similar to one already in action for the PoliVisu pilot city – Pilsen (see the image below or watch a video of TraMod in action). This application allows users to calculate various traffic scenarios (i.e. change free flow speed/capacity of road segment) in near real time via only a web browser with network connection.

Challenge #3: Deep learning for weather forecast

Mentors: Ondrej Kaas, Jan Horak, Michal Kepka

The goal of the challenge is the adaptation of machine learning for the weather forecast in the local environment. The global historical data about climate conditions over a specific area (i.e. temperature, humidity, etc.) and also with greater dense time-series from sensors covering the same area will be used. The precise combination of these data with a compound of algorithms of deep learning can lead to weather forecast enhancement. The entire problem can be seen as a prediction of multivariate spatial data with different accuracy and importance.

In the machine learning domain, several approaches are used to extract multivariate sequence dependence.

In the field of neural networks, there are exists a kind called recurrent neural network (RNN) into which belongs architecture Long Short Term Memory (LSTM). LSTMs are explicitly designed to avoid the vanishing gradient problem. Hence there broadly used for time-series prediction.

Further, a radial basis function (RBF) networks are commonly used for function approximation problems. An RBF network is a type of feedforward neural network composed of three layers that use radial basis functions as activation functions. These networks are distinguished from other neural networks due to their universal approximation and faster learning speed.

And last, not least Bayesian Neural Network (BNN). Bayesian Neural Networks (BNN) is NN whose weights or parameters are expressed as a distribution rather than a deterministic value and learned using Bayesian inference. Their innate potential to simultaneously learn complex non-linear functions from data and express uncertainties.

Available tools:

  • Web-based JupyterHub exposing Anaconda environment.

Tasks for this challenge can be wrapped-up as follows:

  • Preparation of training data that precisely combinate the global and local phenomenons
  • Adaptation of several machine learning approaches and compare the prediction among them.

Yes, I want to register for Challenge #3!

Challenge 12: Interchangeable map compositions in support of collaborative spatial intelligence

Mentors: Raitis Berzins, Runar Bergheim, Karel Charvat, Dmitrij Kozuch, Jan Vrobel and Irena Koskova

Significant progress has been made in standardization of data access protocols and implementation of servers and clients capable of combining and visualizing remote datasets through mainstream OGC standards like WMS and WFS. This allows information to be flexibly re-used across organizational and thematic boundaries.

This allows people to build spatial applications that combine public, proprietary and private information for a multitude of purposes ranging from spatial planning, to smart agriculture and, of great relevance of late, crisis management. However, as long as we only share data, this requires the users to be proficient with GIS and a wide range of technical concepts.

“Maps are where data are transformed into knowledge”, as the GIS-cliche goes, but while the phrase is worn the fact remains valid.

It would add significant value to both government, business and private tasks if we had a mechanism for sharing complex map compositions that combine data sharing services, cartography, visualizations and geospatial markup. Shared map compositions should be possible to explore and interact with in mainstream proprietary and open source GIS tools and both online and desktop environments.

The importance of this challenge is underlined by the current COVID 19 pandemic that strengthens the need for online collaboration and smart use of technology to manage crisis, supply, logistics and policies.

This challenge seeks to further develop a proposed standard format for interchangeable map compositions building on the results of several previous hackathons. A map composition standard opens the door to another interesting innovation, namely an application that is to maps what Google Docs is to text documents.

The challenge will work in parallel with evaluating and extending the current draft specification for JSON map compositions as well as build a working prototype of a web based collaborative map builder application. It will be also be possible to share the map compositions with desktop platforms (QGIS) as well as on various social media platforms.

This challenge is prepared together by two projects SmartAgriHubs and PoliRural and four Digital Innovation Hubs will be included: SmartAfriHub  https://www.smartafrihub.com/home, PoliRural https://hub.polirural.eu/home, FOODIE SmartAgriHub https://www.agrihub.cz/home and http://dih.bosc.lv . The challenge will be part of both the Kampala INSPIRE hackathon https://www.plan4all.eu/kampala-inspire-hackathon-2020/ and Dubrovnik INSPIRE hackathon https://www.plan4all.eu/dubrovnik-inspire-hackathon-2020/.

And also shared on social media


Yes, I want to register for Challenge #12!

Challenge #6: Integrating INSPIRE with Citizen Science and Earth observations authentication systems

Mentors: Andreas Matheus, Hector Rodriguez

The scope of the challenge is to enhance your geospatial and/or INSPIRE enabled web-based or mobile application so as to connect  to eitherCitizen Science and/or Earth Observation data. More specifically, the challenge will focus on improving accessibility to protected resources while also enabling their direct consumption and utilisation by third party applications. 

For enhancing your existing web-based or mobile application to contribute to citizen science and crowdsourcing activities within the LandSense Citizen Observatory (https://landsense.eu), you would need to implement OpenID Connect into your application that is able to interact with the LandSense Authorization Server (https://as.landsense.eu/). The LandSense Authorization Server is a core output from the project and more details can be accessed from the public deliverable “LandSense Engagement Platform – Part I”.

In order to initiate registration, you can choose to use a static registration page or leverage the RFC 7591 compliant dynamic client registration endpoint. A registered application can then use the LandSense federation including login options from Google, Facebook or eduGain (approx. 2800 University and Research organizational logins). The collection and processing of any personal data is compliant with the EU’s General Data Protection Regulation (GDPR). However, when registering the application, you can control the degree of personal information you need: A user can be simply authenticated, labelled with a cryptoname or identified with personal information. 

In order to contribute to Citizen Science with your application, you will need to interact with the LandSense platform. Additionally, you may use an OGC SensorThings API for accessing existing data or inserting new observations from the  SCENT Harmonisation Platform (http://scent-harm.iccs.gr/). The latter includes an OAuth2 Resource provider that is also integrated within the LandSense federation. 

Last but not least, you will have the opportunity to connect also to NextGEOSS Single Sign On (https://nextgeoss.eu/platform-services/user-management/) and integrate within your application protected EO resources or utilise existing applications. Additionally, details on how to interact specifically with NextGEOSS User Management system are available from here: https://github.com/ec-nextgeoss/nextgeoss-integration-guide-um

As a participant in this challenge, you should be familiar with OpenID Connect / OAuth2 principals and the developer of the application that you bring to enhance. You will learn during the hack-a-thon how to integrate a OpenID Connect library like HelloJS into your web-based application and how to setup the library to connect to a 3rd party OpenID Connect Authorization Server.

Yes, I want to register for Challenge #6!

Challenge #8: Improve interoperability between methods for sharing in-situ and citizen-sourced data

The goal of the challenge is to make available datasets provided by H2020 Citizen Observatories as well as other citizen-science projects and initiatives, through the use of SensorThings API standard and develop and test tools to provide combined visualization of data coming from different sources. This involves also sharing of environmental measurements coming from different IoT devices and in-situ monitoring sensor networks, aiming to establish combined use of data and services among different platforms towards improved environmental monitoring. 

More specifically, most of the latest projects and initiatives rely their implementation on the use of different standards like OGC Sensor Observation Service (SOS), that defines a web service interface which allows querying observations, sensor metadata, as well as representations of observed features, or more frequently used standards such as the OGC Web Feature Service. On the other options, a lot of initiatives is defining own specifications respecting needs of current projects. Integration of such data is connected with additional effort spent on development of specific translators.

Such standards (i.e. OGC SOS)  are more applicable to in-situ sensors that have a fixed location, and thus not fitting the citizen science paradigm that involves monitoring of an environmental phenomenon with different portable sensors at different locations (lack of flexibility between the location and the sensor as well as between the user and the sensor). Moreover, the implementation of requests such as the extraction of latest observations from sensors cannot be executed in an efficient or scalable way. 

Thus, the key use cases under this challenge are described as follows: 

  1. Implementation of “data translators” that will facilitate the conversion of resources exposed from OGC SOS and WFS to SensorThings API compatible schemas. In particular, the SensorThings API implementation provided by the SCENT Citizen Observatory shall be used as a reference application where the resources from other projects will be ingested. 
  2. Visualisation of resources exposed by SensorThings API through dedicated interfaces 
  3. Integration of different datasets of environmental monitoring by utilization of special “data translators”.
Yes, I want to register for Challenge #8!

Challenge #7: Establish the connection of Citizen Observatories resources with central catalogue

The goal of the challenge is to enable the integration of datasets provided from Citizen Observatories as well as from other citizen-science related projects and initiatives, with the NextGEOSS catalogue as an approach to connect citizen science into GEOSS. 

In the context of the European Union’s Horizon 2020 research and innovation programme, four sister projects on Citizen Observatories (COs) for Environmental Monitoring (GROW, GroundTruth 2.0, LandSense and SCENT) have been launched and realised. During these projects, a variety of smart and innovative applications have been implemented, enabling citizens to be engaged with environmental monitoring during their everyday activities. The use of mobile devices and low-cost portable sensors coupled with data analytics, quality assurance and modelling approaches pave the way for citizens to have an active role and voice in environmental decision-making.  The capabilities of the abovementioned tools and approaches have been demonstrated in a variety of citizen-science campaigns, being conducted across different European regions and beyond, leading to the collection of valuable environmental information. The datasets involve the following themes: 

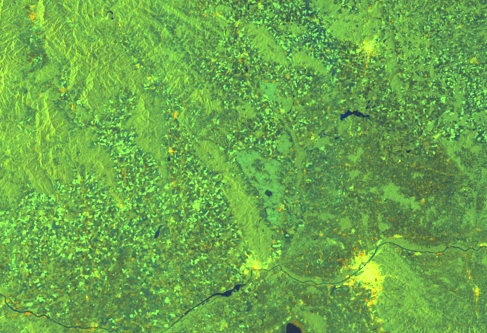
  • Land cover/land use (point observations, maps, change detection validation, land use classification, in-situ validation, cropland field size and interpretations) 
  • Soil parameters (soil moisture, air temperature, levels of light); Planting and harvesting dates
  • Water parameters (water level, water velocity) 
  • Air quality parameters (black carbon concentration) 
  • Phenological observations (species and pheno-phase identification)
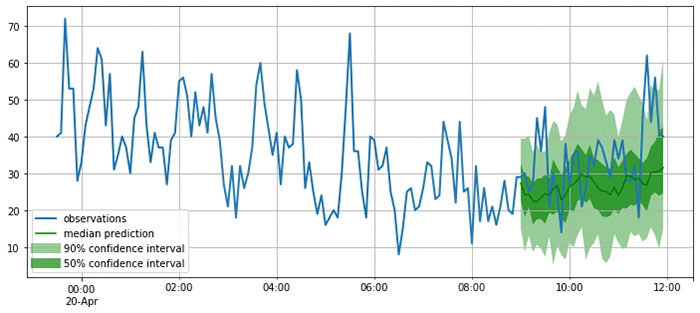
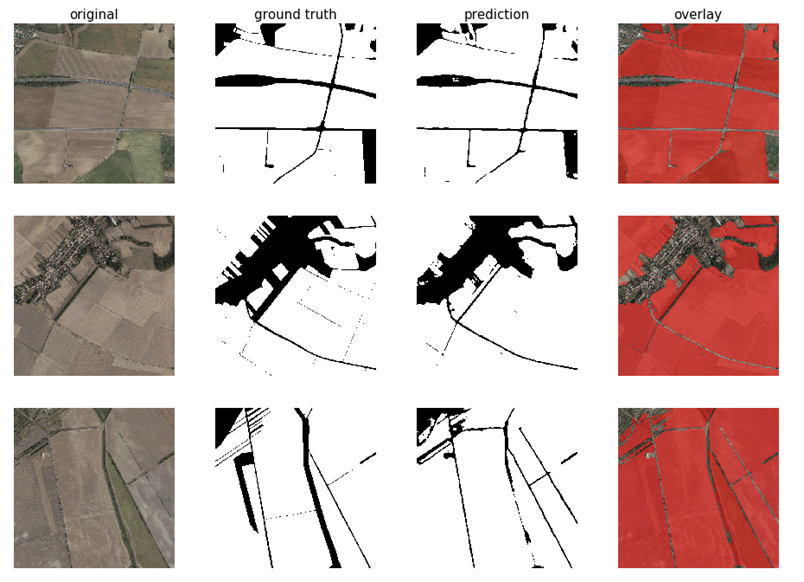
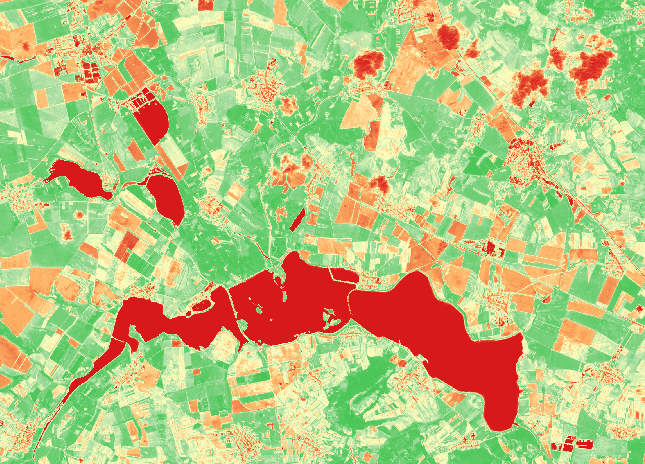
  • Disaster resilience (maps and time series data related to flood monitoring)
  • Urban green space quality (users’ perception through the provision of responses to questionnaires and images) 

The datasets are being managed by different infrastructures involving various access endpoints as well as the utilisation of OGC standards (i.e. WMS, WGS, SOS, etc), while at the same being accompanied by dedicated metadata. 

Thus in order to facilitate the metadata ingestion in the NextGEOSS catalogue, continuously running harvesters (for the Data Sources which have new Data available daily) and on-demand harvesters (for static collections of Data) shall be implemented. 

Yes, I want to register for Challenge #7!

————–

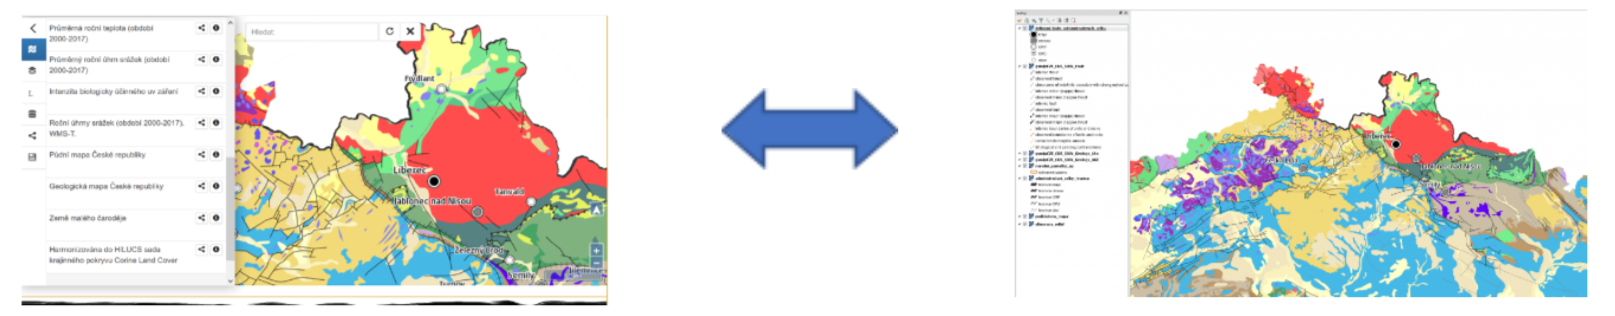
Data Cataloguing in NextGEOSS

One of the offers available in NextGEOSS is the Data Cataloguing. Catalogue data in NextGEOSS can bring some benefits such as:

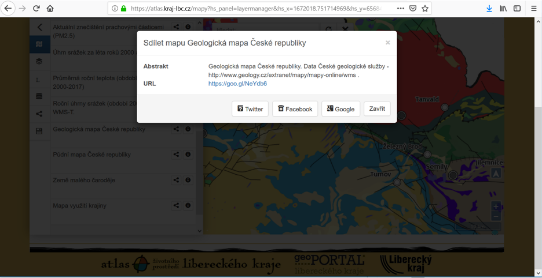
  • Your Data will be EASILY DISCOVERABLE and REACHABLE to a wider audience like the entire GEO Community through the NextGEOSS catalogue;
  • Original Data Sources and Data Providers will be more visible. On the NextGEOSS catalogue there is a page listing all the Data Providers;
  • Easy access to input Data to be automatically ingested by applications due to the OpenSearch interface which allows to find the datasets catalogued and the enclosure links to where the real Data is;
  • Data catalogued in the NextGEOSS Catalogue can be used by the scientific communities in their applications;

NextGEOSS Catalogue does not store data. Only metadata and download links to where the real data is stored (enclosure links) are catalogued. The metadata ingestion in the NextGEOSS catalogue is quite flexible since it is possible to harvest metadata from different interfaces such as OpenSearch, CSW, WFS, CKAN API, REST API, OAI-PMH and others. Also different types of Data Connectors, depending on the frequency of the Data publication on the original Data Sources, can be built:

  • Continuously running harvesters (for the Data Sources which have new Data available daily)
  • On Demand Harvesters (for static collections of Data)

NextGEOSS Harvesters have also recovering mechanisms to deal with possible failures that may happen on the data catalogue or on the original data source. For example, if the original data source is down for some time, as soon as it is available again, the harvester will restart the harvesting process from the last dataset harvested and will ensure that no data is missing.

To be possible to catalogue metadata in the NextGEOSS Catalogue, there are some requirements that must be fulfilled by the data Provider:

  • A queryable API or interface to access the metadata in the original data source is required (OpenSearch, CSW, REST API, etc.);
  • The access to the original metadata records following a methodically approach is required (for example temporal queries);
  • The metadata fields in the original data source must be clear and, ideally, follow a metadata standard;
  • To have a clear understanding about how often the data is published in the original Data Source (frequency), different product types and if the data belongs to any area of study (such as Agriculture, Marine, Food Security or others);
  • Data Provider must keep the real data available for a considerable time period to ensure that the links to the original data on NextGEOSS Catalogue are not broken links;
  • To have a good availability and short response times when querying the original data source;

All of these requirements are considered during the feasibility analysis performed by the development team. If the requirements are fulfilled, it will be possible to build the data connector (harvester) which, after a set of tests in a staging instance of the catalogue, will be deployed in production.

Main obstacles to build data connectors:

  • Complex metadata and/or not following any specific standard. Difficult to map the metadata fields;
  • Metadata with many repeated fields and repeated information. Additional metadata filters. needed;
  • Limited APIs and interfaces which do not allow to perform methodical queries and organize the metadata records;
  • Metadata or interfaces that are not mature enough since they are still being updated;
  • Unstable data sources and long response time to queries;
  • Short retention period of the real data on the data provider;Data sources that do not provide links to the real Data within the metadata making it impossible to have enclosure links to the real data on NextGEOSS catalogue;

Challenge #9: EO4Agri Ideathon

Mentors: Karel Charvat, Vaclav Safar

The main objective of EO4AGRI is to catalyse the evolution of the European capacity for improving operational agriculture monitoring from local to global levels based on information derived from Copernicus satellite observation data and through the exploitation of associated geospatial and socio-economic information services. EO4AGRI works with farmers, farmer associations and agro-food industry on specifications of data-driven farming services with a focus on increasing the utilization of EC investments into Copernicus Data and Information Services (DIAS).

The EO4AGRI project methodology is a combination of community building; service gap analysis; technology watch; strategic research agenda design and policy recommendations; dissemination (including organization of hackathons).

The Ideathlon will be focused on the relation of Earth Observation and AgriFood industry. The goal of the discussion will be to validate the existing recommendation from EO4Agri on one side, but on the other side to find new challenges until now not recognised.

EO4Agri identified the next groups of stakeholders in agrifood sector:

  1. Precision Agriculture
    1. Farmers
    2. Advisors and Service organizations
    3. Machinery
    4. Agrochemical providers
  2. Food sector
    1. Food producers
    2. Resellers

Users of Earth Observation data in Precision agriculture, respectively in part Agro-Industry group, can be divided according to whether they are data processors or consumers of results produced by data processors companies. In the first group are: service IT providers, software producers and consultants, and service organizations in the rank of Earth Observation, aerial photogrammetry, drone application, phytopathology, agronomy, interpretation of vegetation data from satellite and aerial images, etc. The second group consists of farmers, engineering and environmental agricultural companies, agronomists, machinery manufacturers and input providers (fertilizers, chemicals). Members in both of these groups must collaborate in order to develop all required applications. Then all will benefit from these applications: farmers can make informed decisions regarding their crops and advisors can sell services to farmers and input providers can use weather and soil maps to predict the demand for fertilizer.

Earth Observation for Precision Agriculture due to its complexity needs to be supported by a full Value-Added Chain, where a farmer is its final point. See the next images:

The food sector is complex and includes different types of producers, where could be different requirements on EO technologies’

As part of the Food sector, we can also include Food resellers, their requirements can be similar to the requirements of part of the food sector. Generally, the interests of the food sector could be divided into two groups:

  • Producers of niche or specific products with high requirements on input materials like producers of pasta, beer, etc. with a strong focus on the quality of production
  • Global food players and resellers, who are mainly interested to have an overview of the situation on the global market of agriculture products

During Ideathlon we will try discussed such questions like:

  • What are the needs of single stakeholders groups?
  • What is the relation of these groups of stakeholders?
  • Who are real drivers among stakeholder in the agrifood sector for utilisation of EO?
  • What are the requirements in satellite technologies and also in processing?
  • What are the biggest problems?
  • What are dreams for the future?
  • Which solutions are now missing?

The results of this analysis will be based for a future recommendation for industry, but also for EC.

 Yes, I want to register for Challenge #9!

Challenge #2: Using AI intelligence for detection of Land Use objects

Mentor: Hana Kubíčková

“Precision agriculture is a management strategy that gathers, processes and analyzes temporal, spatial and individual data and combines it with other information to support management decisions according to estimated variability for improved resource use efficiency, productivity, quality, profitability and sustainability of agricultural production” (An International Journal on Advances in Precision Agriculture, 2019) In other words, precision agriculture is an approach to farm management that ensure crops and soil receive exactly what they need for optimal health and productivity. In order to take the necessary action at the right time, to the right extent and on the right place, it is necessary to obtain the maximum amount of information relating to the field as possible. This includes not only the composition of the soil, the thickness of the topsoil and the supply of nutrients, but also the precise spatial delimitation of the field and information of the types of crops grown on particular field. 

In the Czech Republic and many other European countries, this spatial and land use information is stored and regularly updated in the land register called Land Parcel Identification System (LPIS). However, if we want to use this information as input for precision agriculture use, we will encounter a major problem. This occurs when several type of crops are grown on the same field and we do not know the boundaries of individual crop types – the quotient of individual crops only – see Fig. 1. 

Fig. 1 Example of parcel with different land uses

Accurate information on field boundaries is very important input for many reasons: eg. having accurate information on crop types and boundary defining a given soil block, we can for example determine the yield potential or the amount of fertilizer needed for given type of crop very precisely. 

The reason why these boundaries information are missing in LPIS lies mainly in the time consuming manual updating of the database. Therefore, automated methods are now being sought to detect precise field boundaries if they are not available in digital form. 

One possible way is to exploit the potential of satellite imagery, which provide a wealth of information about Earth’s surface and are available as open data. 

The aim of this challenge is to find possible machine learning algorithms and artificial neural networks that can be used for field boundaries detection from Sentinel 2 or Landsat images. 

Available tools:

Web-based JupyterHub environment exposing a set of powerful Python-based tools. Anaconda platform provides plenty of NN, DL, ML. It is start point of every Data Science who likes Python”

Thanks to Anaconda Cloud following can be installed easily:

  • Scikit-learn
  • Keras
  • Tensorflow
  • OpenCV
  • Vowpal Wabbit
  • And many, many more

Fig. 2 Results of previous attempts on field boundaries detection using convolutional neural network UNet.

 Yes, I want to register for Challenge #2!

Challenge #1: Using Sentinel 1 data and IoT technology for analysis of soil moisture

Mentor: Jiri Kvapil

The amount of water available during the crop plantation phase is one of the key factors involving quality and quantity of agriculture production. Knowing current soil moisture and its development is very important for both irrigated and non-irrigated arable land cultivation. Spatial heterogeneity of soil moisture can vary substantially, it is challenging to cover larger fields using in-situ measurements even with IoT powered wireless sensor network (WSN). Satellite data help to overcome this shortage, however cloud coverage might waste the whole image when working with optical data. Luckily, radar satellite data is available, but their processing is not at all trivial task and requires a lot of theoretical knowledge and practical skills.

Challenge 1 will be focused on soil moisture measurement from Sentinel 1 satellite radar data in comparison to WSN in-situ data and Sentinel 2 optical data. For green plants there is a relation among soil moisture, surface temperature and amount of chlorophyll. 

Main objective of Challenge 1 would be soil moisture assessing and finding and mapping of any relevant correlations between optical and radar data to densify optical data with radar data for periods of cloud coverage, when optical data can’t be used. For practical calibration and verifications of results, in-situ WSN soil moisture data is available.

Tools available to challenge participants

Web-based JupyterHub environment exposing a set of powerful Python-based spatial data visualisation, analysis and manipulating tools will be available. These are GeoPandas, eo-learn and many others allowing for spatial and satellite imagery analysis using your web browser and working on a remote JupyterHub server.  Apart from that, set of other third-party tools is also available on the server- just mentioning some of them – GDAL, Orfeo Toolbox, GRASS, QGIS API, etc. But that is not all, users can even use custom developed and focused tools aiming at data processing, visualisation and publication – mostly LayMan and SensLog. 

Layman is a tool to facilitate the management of spatial data, SensLog is focused on sensor data manipulation. There is even QGIS plugin available allowing for easy publication of map compositions as map services.

Sentinel 1 and Sentinel 2 images from target locality will be available to event participants for  satellite imagery classification workflows. Sentinel 2 images are available in L2A level of processing, i.e. after atmospheric corrections, whose have already been calculated for your convenience including NDVI images (see example below).

Hackathon participants can utilize tools for unsupervised or supervised classifications of optical data using both statistical and neural network-based methods as well as the calculation of various vegetation or other indices, try to estimate the type of land cover, classify the type of crops, etc.

For Sentinel 1 data the amount of available server based tools is very limited, usage of SNAP software is advisable for radar data processing.

 Yes, I want to register for Challenge #1!