
FINAL REPORT ON CHALLENGES
#5: Analysis and visualisation of sensor measurements
#6: IoT and EO data integration
Name of mentor(s): Karel Charvát, Michal Kepka Number of participants: 10+11
FINAL REPORT CH05+CH06 [PDF, 5MB]
INTRODUCTION
Earth Observation (EO) data are important for many domains and such data are step by step very important for agriculture in recent years. We can distinguish two types of data under the EO scope. We can speak about sensor data produced by local measurements on farms for different phenomena monitoring. On the other side we can speak about Remote Sensing data produced by satellites on orbits for global monitoring and different spatial resolution.
We agreed to join the effort of Challenge #5 and #6 when both challenges are using EO data and both are utilising the same end user application – FIE20. There are similar main objectives that can be generalised to the following three points:
- Process sensor data, produce calculated results.
- Integrate sensor data of different
- Access sensor data and its products to the final
There is a main focus not only to collect and store data, but to process it and bring such type of data to the final user in a suitable way.
From the perspective of the sensor data, we were mainly focused on processing of data from season 2021 when a high density sensor network observation campaign was operating and providing results of analyses to the user for further utilisation.
From the perspective of the Remote Sensing data we were mainly focusing on integration of additional layers to the existing solution FIE20.
METHODOLOGY
- Team description
The core team consisted of main developers of SensLog, SensClient and FIE20 applications. The core team was cooperating during defined tasks of challenges and was cooperating with other challenges, especially CH04.
- Technical Background
Sensor data were collected in the SensLog solution where the dataset was processed by internal check mechanisms. Senslog is an open sensor data management solution for receiving, storing, processing and publishing of sensor data. It can work with static as well as mobile sensor data. SensLog has side applications extending its functionality. One of these side-applications is SensLog Analyst providing larger analytical functionality – statistical processing, thresholds monitoring, multi-phenomena monitoring. Another side-application is the SensClient providing sensor network metadata editor and initial data visualisation.
The solution FIE20 Groundwater and meteo sensors (developed under the SmartAgriHubs project in the scope of the Flagship Innovation Experiment) is an expert system to support farmers in decision-making process and planning process of field interventions. This FIE20 solution integrates various data sources and different analytical processes in a complete system and provides users an easy-to-use web map application as a common user interface. The FIE20 system integrates components developed during the SmartAgriHubs project with results and components developed during previous European research projects – namely FOODIE, DataBio and EUXDAT. The FIE20 solution utilises components of the SmartAgriHubs Digital Innovation Hub as well as AgriHub CZ&SK services.
Main services of Remote sensing data and processed indices used for integration to the FIE20 application were used from the FOODIE AgriHub platform.
- Description of the process of solution
Data from the high density sensor network were processed to filter and identify drop outs of the network during the operational time. The result is the data set of almost 3 millions of observations, filtered and aggregated to hourly data.
Services on the background part were improved to serve such a large amount of data from the high density sensor network.
The FIE20 application was extended by a set of services to load data from the FOODIE AgriHub and by a new module for interpolating sensor datasets with defined common time range of observations.
- Data & Equipment list
The sensor network was collecting on 98 soil nodes following phenomena:
- Air temperature and humidity in low level above the ground
- Soil temperature and volumetric water content in 2 horizonts
The original measuring period was 15 minutes which was aggregated to the hour period for further calculations and visualisations.
Remote sensing datasets were downloaded from Copernicus Hub and processed on the infrastructure and provided by the FOODIE AgriHub platform.
- Detailed implementation plan
The main set of steps followed the data flow of sensor observations and steps to process remote sensing data to meet the common area and time period. Based on the discussion with the farmer, the main target period was 2020-2022. Where the observation campaign continues during the year 2022.
- Analysis of needs of stakeholder groups
The main agricultural challenges that the FIE20 solution is addressing can be divided in three parts. Firstly, the challenge is to integrate various and heterogeneous data from different sources to one system and to present this integrated data in an usable and understandable form to farmers. Secondly, utilisation of integrated data in combination with external services in a set of analytical functions to provide farmers enough information as a support of decisions. And last but not least, the way to visualise and present results of analyses to extract information and added values by the most of users of the solution. The solution utilises a combination of cartographic visualisations, interactive charts and diagrams.
- Experimental results
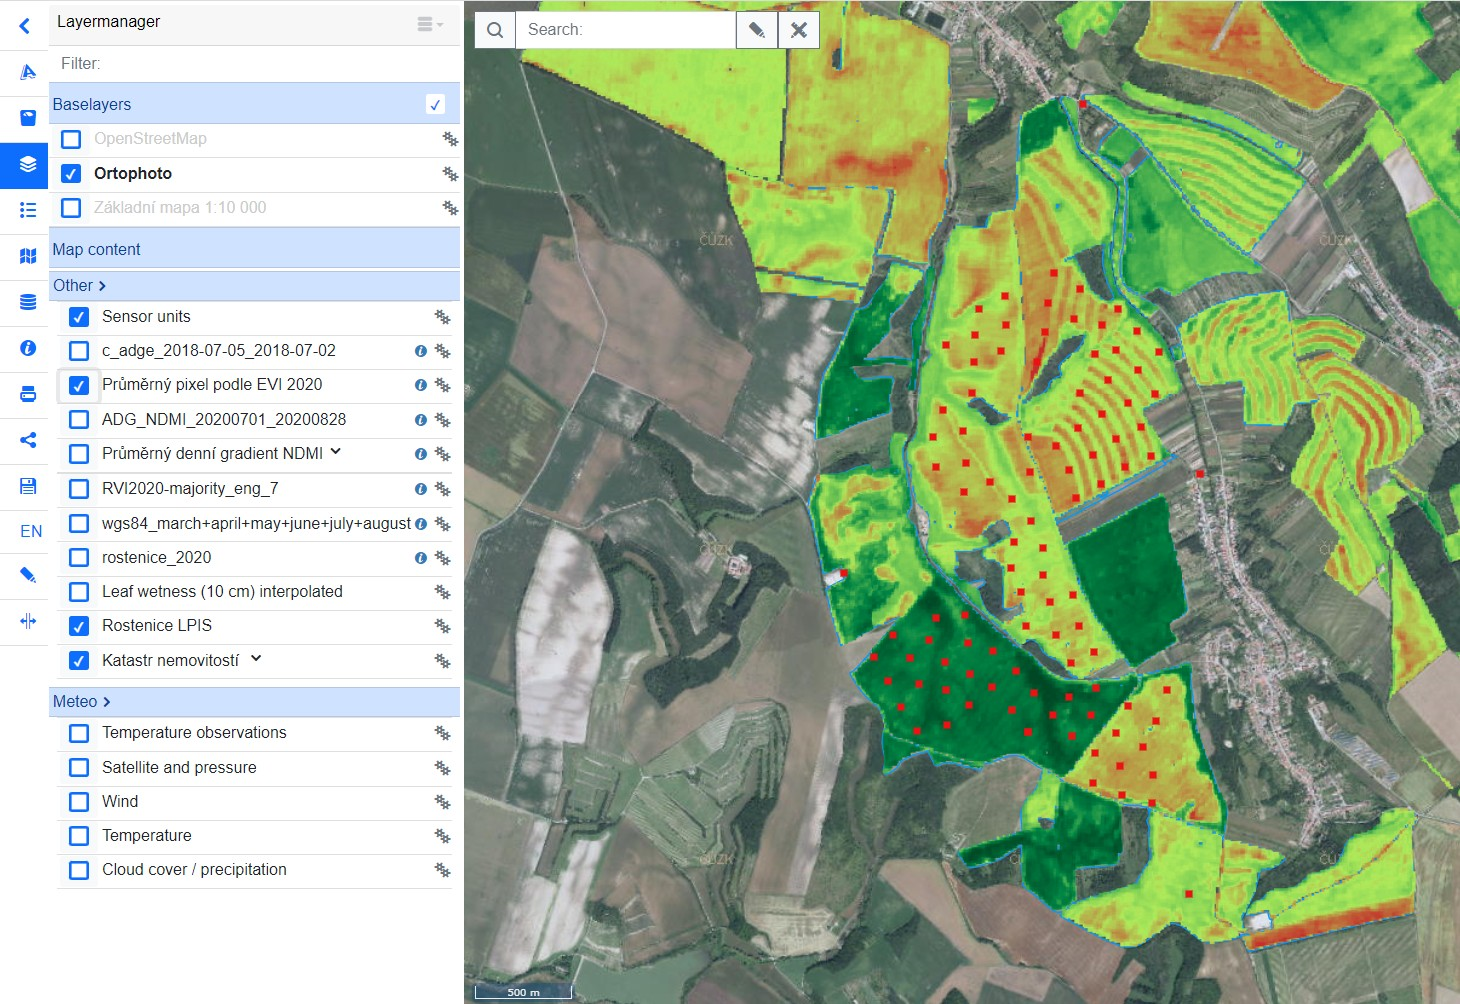
One of the most important results of the Challenge is the final integration of sensor data together with a set of Remote Sensing products and indices in one web map application.
Following screenshot presents the FIE20 web map application with loaded different indices and location of sensor nodes.
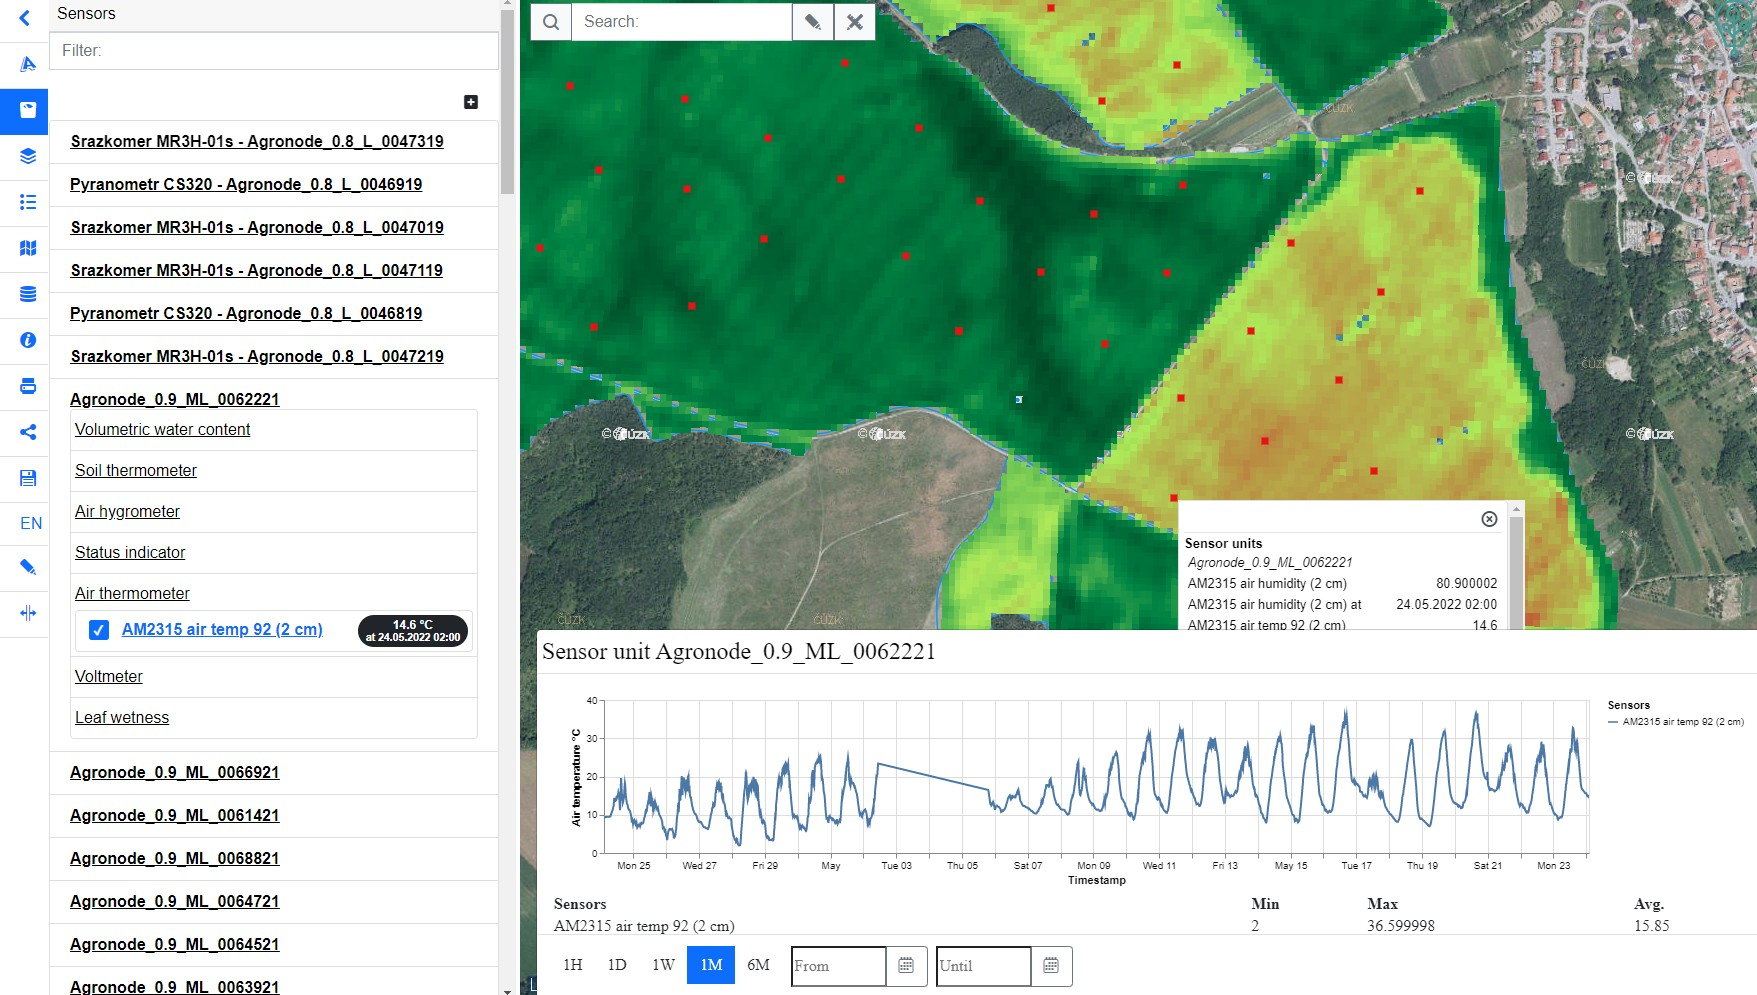
And in detail visualising in map window indices, location of sensor node and chart of selected phenomena.
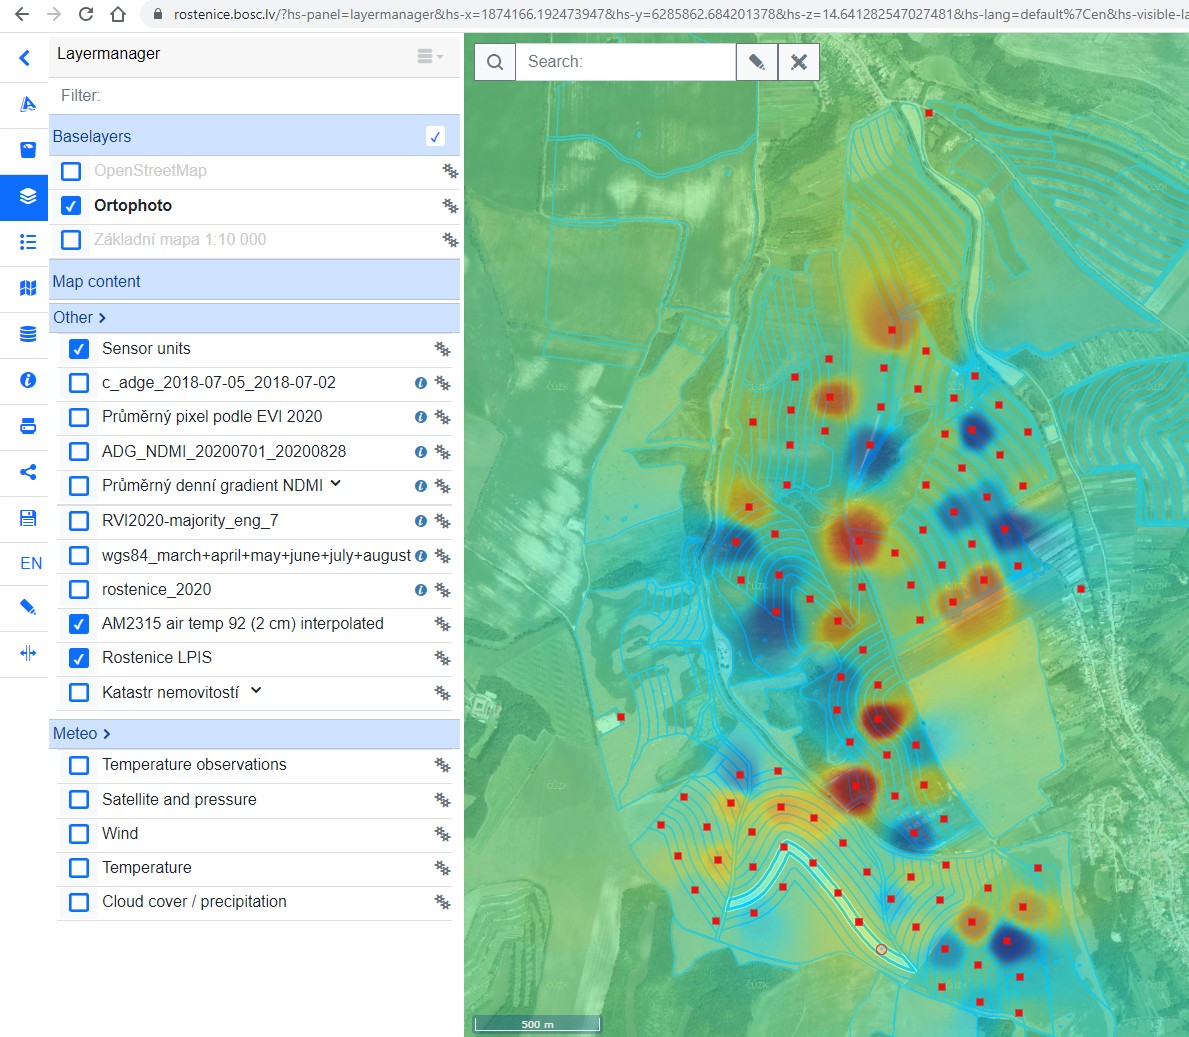
Another result is the additional functionality for sensor data visualisation. Last values of observations can be presented in the form of interpolated layers to provide a general overview of values distribution in a particular area of interest.
Following screenshot presents FIE20 with an interpolated layer from sensor data of defined time range.
A side result of the improvement of the SensLog background services is to define styles for export methods. Users can get data in crosstab or timeseries style. Examples are following for one specific phenomenon from group of sensor nodes:
- Crosstab
| Timestamp | nodeID01 | nodeID02 | nodeID… | nodeIDN |
| “2022-05-01” | value01 | value02 | value… | valueN |
| “2022-05-02” | value01 | value02 | value… | valueN |
- Timeseries
| NodeID | “2022-05-01” | “2022-05-02” | timestampN |
| nodeID01 | value01 | value02 | valueN |
| nodeID02 | value01 | value02 | valueN |
| … | |||
| nodeIDN | value01 | value02 | valueN |
FINDINGS & CONCLUSION
- Discussion of the results and findings
The main outputs of the challenge show that the way of data integration is a crucial step of any support for the decision-making process. There is a wide spectrum of services and functionality a web map application can provide to the farmer. Important is the option to combine different data sources based on the decision of the farmer.
- Further improvements
Main improvements for the next development is to harmonise selecting of timestamps or time periods of data to visualise in the same map window. On the interpolation side, there is a need of cropping by the defined area of interest polygon and possible comparison of two different states.