
FINAL REPORT ON CHALLENGE #4: Climate analysis in the field
Name of mentor(s): Karel Jedlička Michal Kepka Tereza Šamanová
Number of participants: 17 participants from 12 countries
FINAL REPORT Challenge 04 [PDF, 5,2MB]
INTRODUCTION
Background of the challenge
In the Autumn AgriHub INSPIRE HACKATHON 2021, the challenge Extreme weather aimed to seek for:
- Exploitation of the possible use of Copernicus Emergency Management services including European Flood Awareness System and European Drought Observatory,
- Integration of the information from volunteer observatories of extreme events repositories to provide additional source of information to be assimilated with traditional observations available or to complement missing observations (e.g., hail) to be used for g., insurance claims,
- Integration of VGIs and citizen science data to validate/assimilate/train remove observations (e.g., crop diseases, grow monitoring).
As a result, the challenge Extreme weather has discovered that, for farmers, it is not their main problem to make practical use of the awareness and observatory systems, but more to have a look at the micro-climatic conditions and specialties in their properties and their specific parts to plan well the crop management and to prevent potential damages caused by extreme weather conditions. Thus the challenge has, based on brainstorming and discussions within the challenge team, prepared a draft project called System of smart growth and crop protection reflecting the current micro-climatic development and weather forecasts respecting the individual position of the field.
During the OpenSpring Hackathon 2021 the main design of the AgroInfo application was created in the Challenge #8: AgroInfo Application. The initial results can be found on the Agrihub portal (see the following figure).
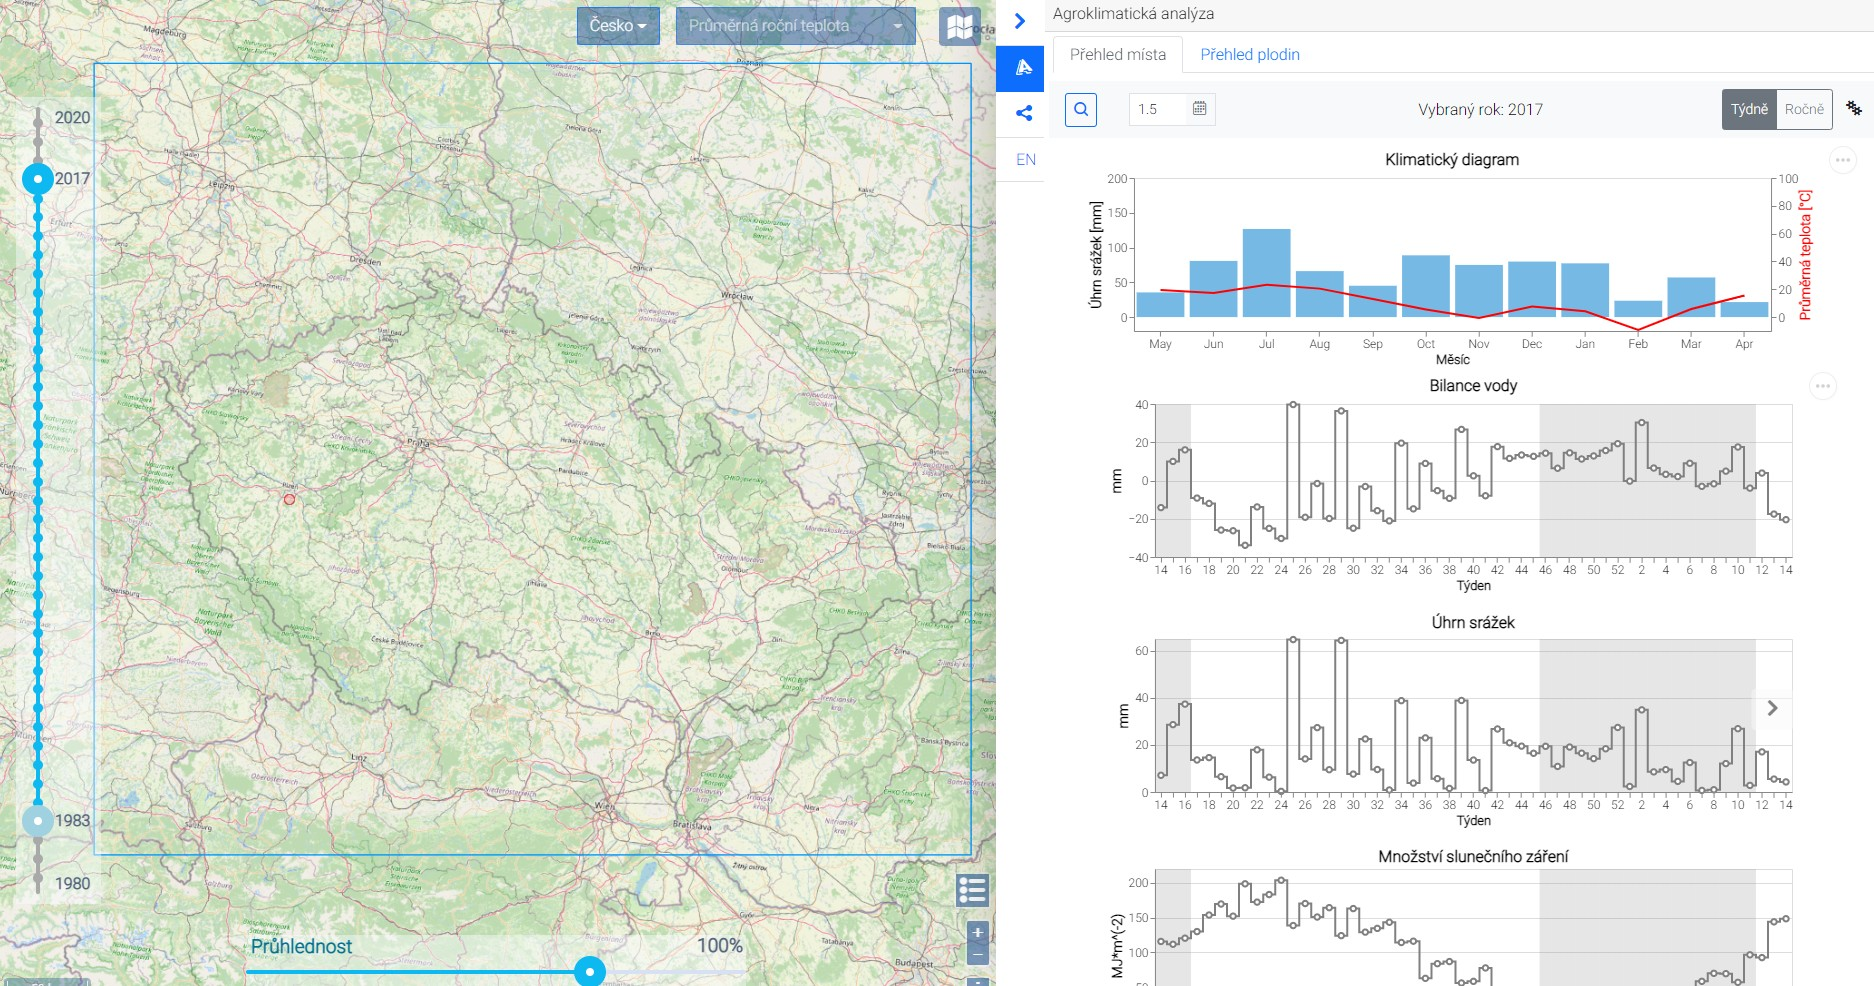
Figure – The initial AgroInfo application design
The initial version of the AgroInfo application was mainly focused on visualization of agroclimatic factors for selected regions based on the ERA5-Land dataset. Agroclimatic factors are important for understanding of climatic data on the regional level. But there is a limited amount of information users can get/apply on the farm level.
An originally separate experiment was running during the vegetation season in 2021 in the Vyškov region. A very dense sensor network consisting of 100 soil sensors was deployed on fields of the Rostěnice farm on the area of approx. 5 km². These sensors were collecting status of air in the lowest level above ground and soil conditions in two levels underground. This data set is the main source for testing of combination local sensor data with regional climatic data from global sources.
Ambition of the challenge
The concept of the above-described project needed to be validated in multiple locations in CZ and abroad, respecting their individual conditions (latitude, altitude, average precipitation, windiness and other indicators of local microclima). Thus, the inclusion of the experimental farms into this challenge was crucial.
On the other hand, the challenge was seeking also for the existing examples of good practices already running within experimental smart farming systems and systems of observation and measurements in the fields that deals with weather and climate conditions monitoring.
Therefore, the aim of this challenge was to:
- Collect the relevant examples from practice,
- Validate the theoretical basis of the System of smart growth and crop protection
- Develop substance of new product (system) able to enter soon on the market working with observations, measurements, sensors and predictions dealing with weather forecasts and climatic conditions that would help farmers with management of their properties/lands/fields within the principle of smart farming, respecting the climate, weather and specific micro-climatic
Full explanation of the challenge defining the scope of the effort
As described above, the challenge has followed and more developed the former topics of Extreme weather (Challenge #5 within Autumn INSPIRE Hackathon 2021) and AgroInfo Application (Challenge #8 within Spring INSPIRE Hackathon 2021) and aimed to meet the current needs and requirements of the farmers: they are not keen too much on macro-data collection but more on having access to the history and prediction of the conditions in their individual property. The challenge has collected the best practices and data available within similar EU and national projects and forwarded the technological solution (System of smart growth and crop protection reflecting the current micro-climatic development and weather forecasts respecting the individual position of the field) nearer to its introduction on the market.
The results of the present #4 Climate analysis in the field challenge will help farmers to get very detailed information about the field blocks and improve the variability of interventions planning and applications to minimize expensive inputs.
METHODOLOGY
The methodology of the report contains the sections that describe the progress and results achieved for the entire challenge.
● Team description
The team was composed of a group of international experts registered to work on the challenge in the total number of 17 persons coming from 12 countries worldwide (Czech Republic, Slovakia, Belgium, Cameroon, Burundi, India, Nigeria, Pakistan, Uganda, Uzbekistan and Zambia).
The registered experts were invited to send their inputs and, further, they have met with the Challenge mentors within several common brainstorming sessions and team working sessions. As a result, two of the presented applications were collected as examples of best practices, their correlations were analyzed and future works on their integration into one app resulted as recommendation of the team for further development of the topic.
● Technical Background
We can divide the technical components into two main parts – climatic data related and related local observations.
Climatic data components are represented by calculated agroclimatic factors and presented by the Info4Agro1 application.
Agroclimatic factors were calculated from the climatic data provided by the Copernicus Climate Change Service2 ERA5-Land dataset. ERA5-Land is provided in a regular equiangular grid with the spatial resolution of 0.1 x 0.1 (arcdeg), resp. 10 km x 10 km in our pilot region. The time interval of data available in ERA5-Land is one hour and the period 1982-2020 was used for calculations.
The Info4Agro application is a web application providing different functionality based on the level of focus. It is providing a level of farm, field and planned zone level. The main idea is to combine different levels of data for specific use cases on the farm during the whole year, not only focusing on the growing season.
The local observations part is covered by the SensLog solution as the sensor data management solution. SensLog is receiving, storing, processing and publishing sensor data from different sources. The experiment’s local observations were collected by sensor nodes and transmitted via the LoRa network by ČRA covering the whole Czechia.
● Description of the process of solution
To develop the core of the system, we have processed the sensor data from a very detailed sensor network (98 sensors altogether) deployed on a large block of fields. This has shown potential of a completely different level of heterogeneity mapping of such field blocks. The problem is to minimize the number of sensors deployed on the field every season to a reasonable amount. When the initial zoning is defined, external data sources can be utilized to model conditions in particular zones of such field blocks based on historical locality conditions and model predictions.
The main ambition of the observations assessment is to define the critical number of sensors for a zoning definition and sustainability of such zoning for further seasons with support of available global data and models.
2 https://cds.climate.copernicus.eu/cdsapp#!/home
● Data & Equipment list
The sensor network was collecting on 98 soil nodes following phenomena:
- Air temperature and humidity in low level above the ground
- Soil temperature and volumetric water content in 2 horizonts
The original measuring period was 15 minutes which was aggregated to the hour period for further calculations and visualizations.
● Detailed implementation plan
The experimentation was planned as a cooperative work combining results from previous Hackathons with Challenges (Ch#5, Ch#6) in the current Hackathon as well.
During this challenge we were further developing functionality of the Info4Agro application mainly on the level of visualization of sensor observations and integration of forecasts and agro analysis based on climate model data.
SensLog part was mainly oriented on further development of analytical functionality to provide filtered and aggregated data for effective visualization. Export functions developed during the CH05 were utilized and tested in real use cases.
Testing of data integration in the common environment of the Info4Agro application was performed.
● Analysis of needs of stakeholder groups
The main stakeholder groups can be identified as follows:
- Farmers – individual owners of the fields and properties
- Insurance companies – as those who are fulfilling the requests of farmers in the process of solving damages on insured fields and properties caused by unfavourable weather and climate
The main group of needs collected during previous Challenges and the and current hackathon can be summarized by following points:
- provide climate and weather related data for farm in a understandable form
- cover the whole productive year not only focusing on growing season
- provide explanatory visualization of collected data
- provide support of decision-making process by current local situation as well as related forecast in next days
- integrate sensor data with forecasts, analyses and results of EO data
- identify the exact date, place and intensity of the unfavourable weather and climate conditions that has caused a damage on crop or
● Experimental results
The main results can be summarized by several points:
1. Effective visualization of agroclimatic factors was tested.
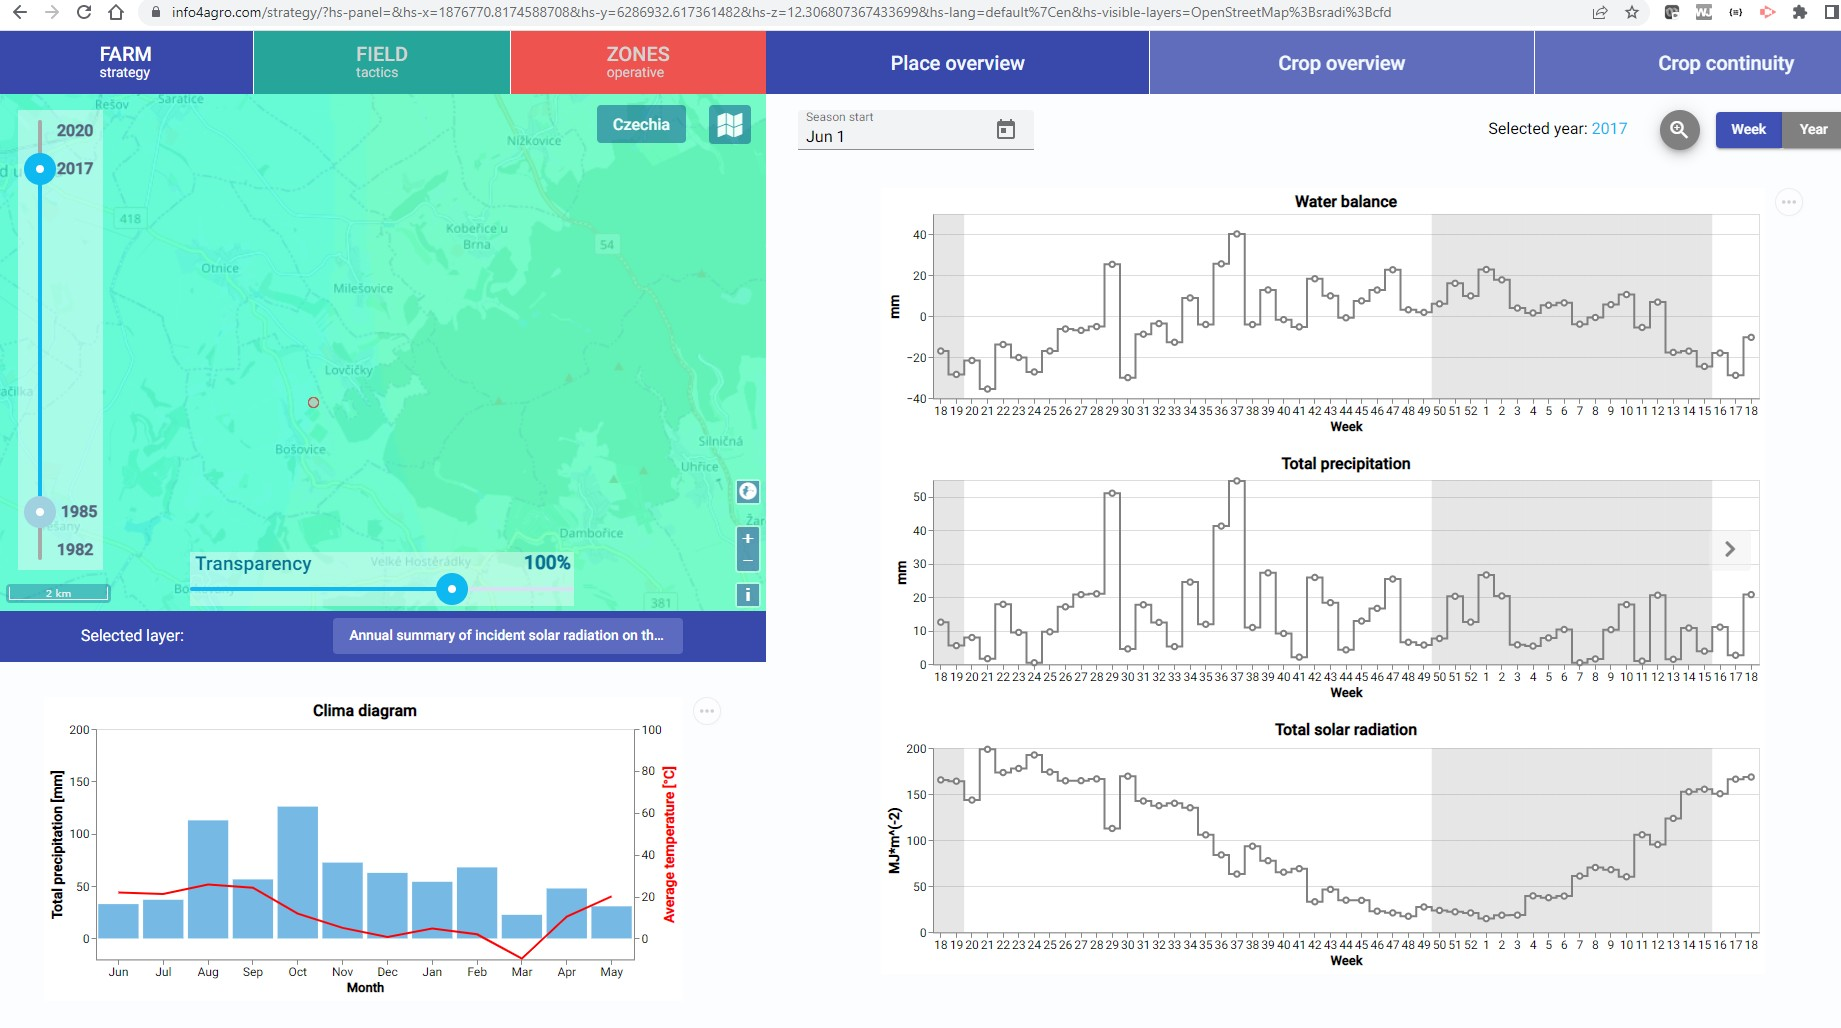
The module for the visualization of calculated agroclimatic factors was tested. It provides users visualization in the form of charts by selecting a particular location in the map window. Users can select the time period of original model data and which factor to visualize. It provides other connected values in charts and interpolated values for a large region in the map window. An example is shown in the following Figure.
2. Integration of weather forecast and agroanalyses were tested
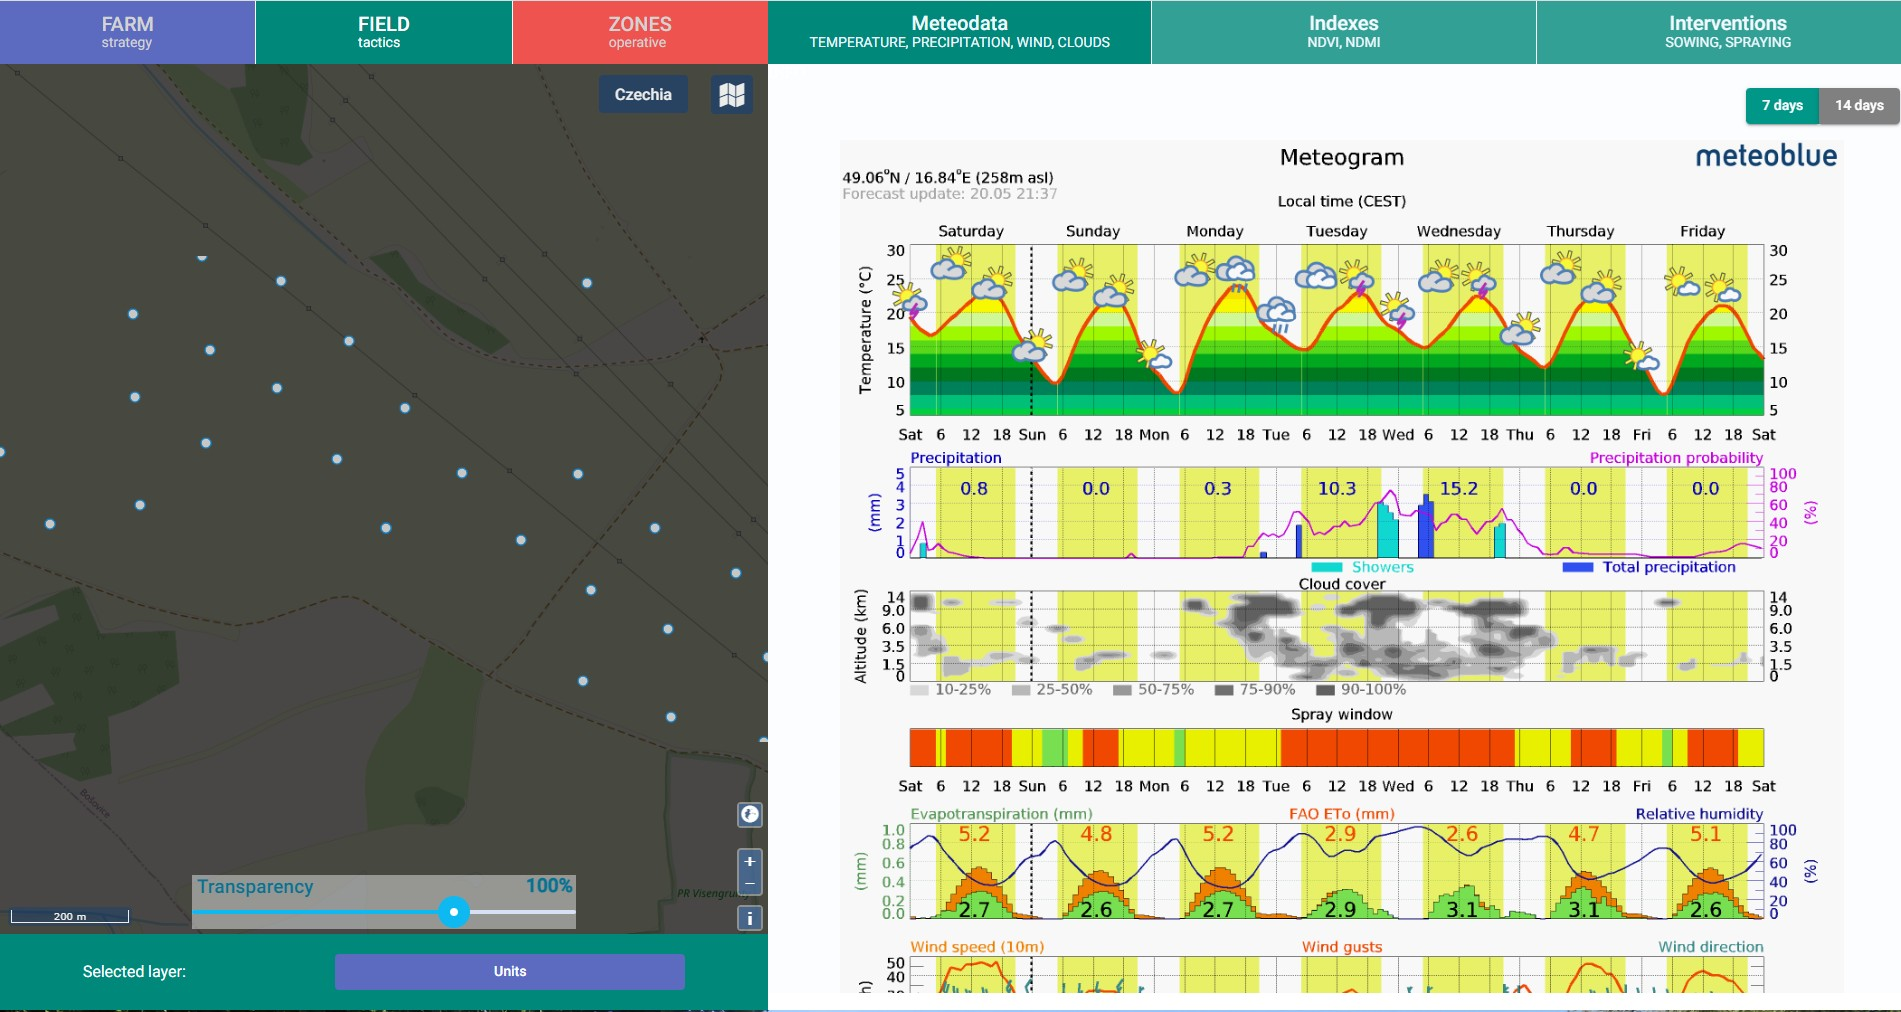
The module for visualization of weather forecast and agroanalyses calculated for a particular location selected in the map window was tested. It visualizes forecasts and analyses provided by the services by meteoblue company. Cooperation with the Swiss company meteoblue AG extends the overall functionality of this module. Example of the 7 days weather forecast diagram is shown in the following Figure.
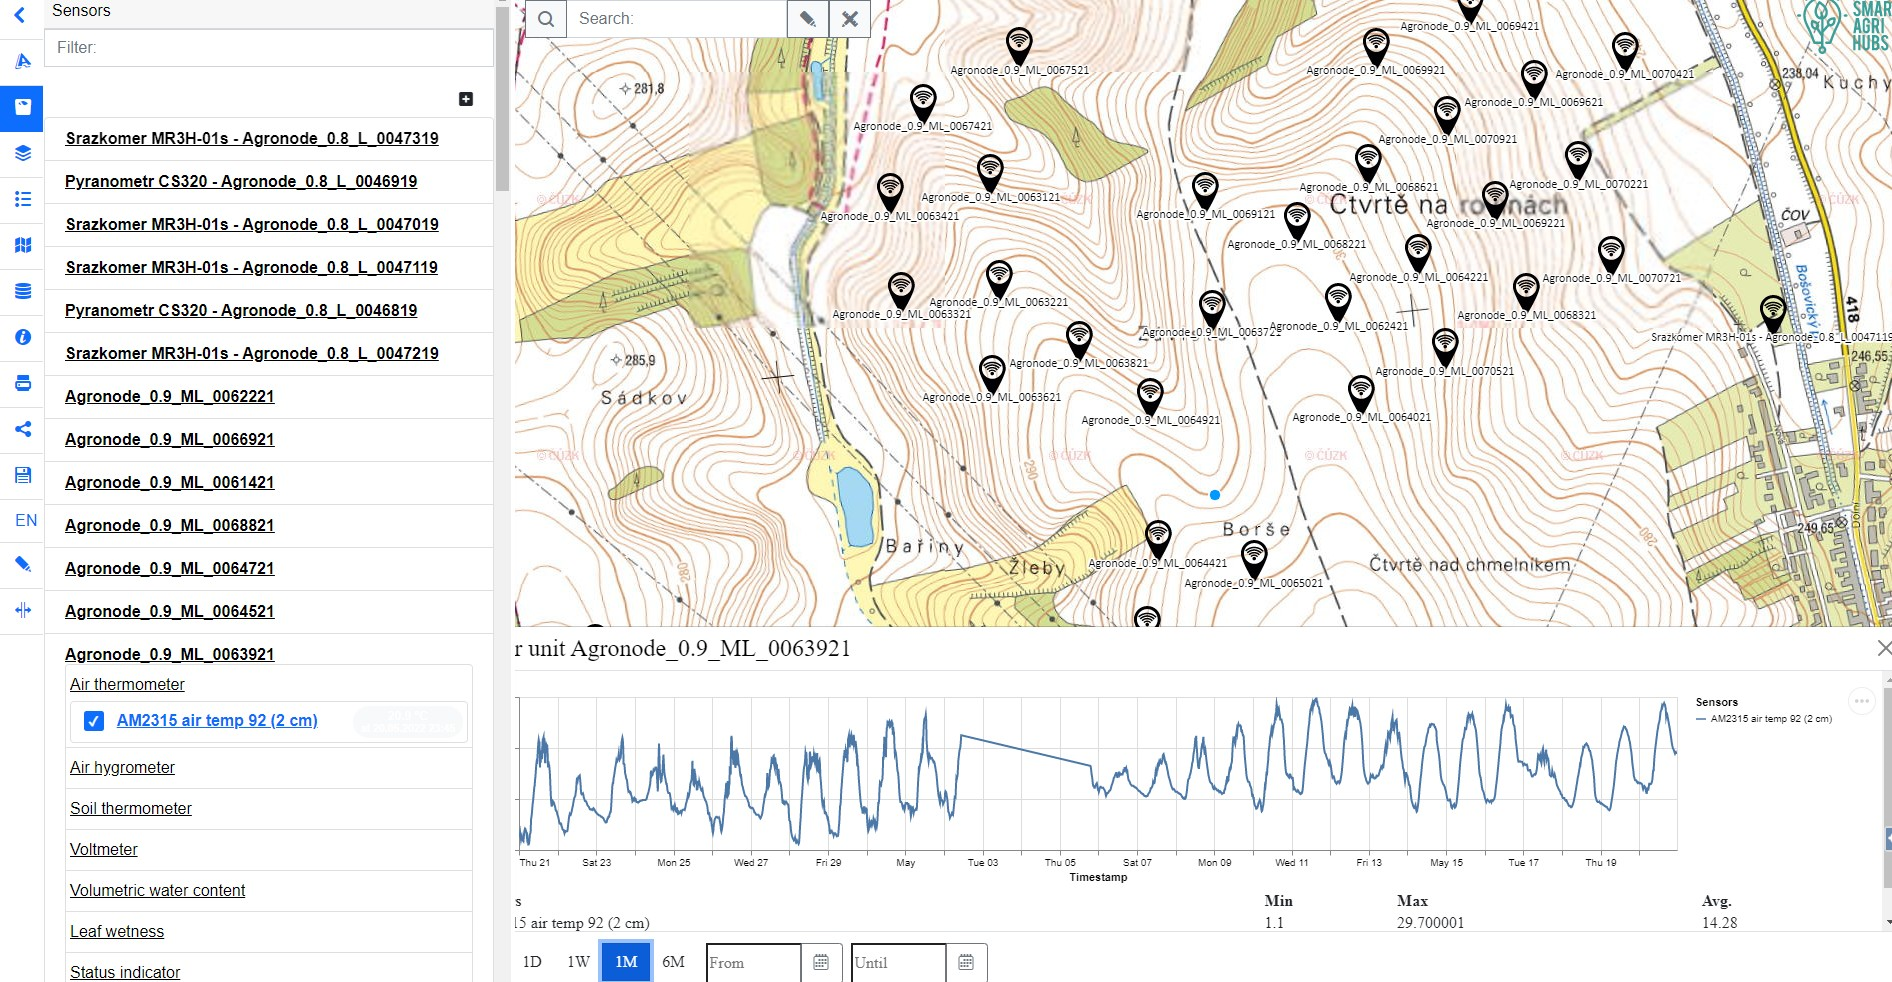
3. Visualization of sensor observations was tested
The module for visualization of local observations provided by individual sensor nodes was integrated into the Info4Agro application. Module provides visualization of sensor locations and by selecting a particular node, it provides visualization of measured data in the form of charts. Users can select a specific time range and an observed property, resp. phenomenon. Example of the module is shown in the following Figure.
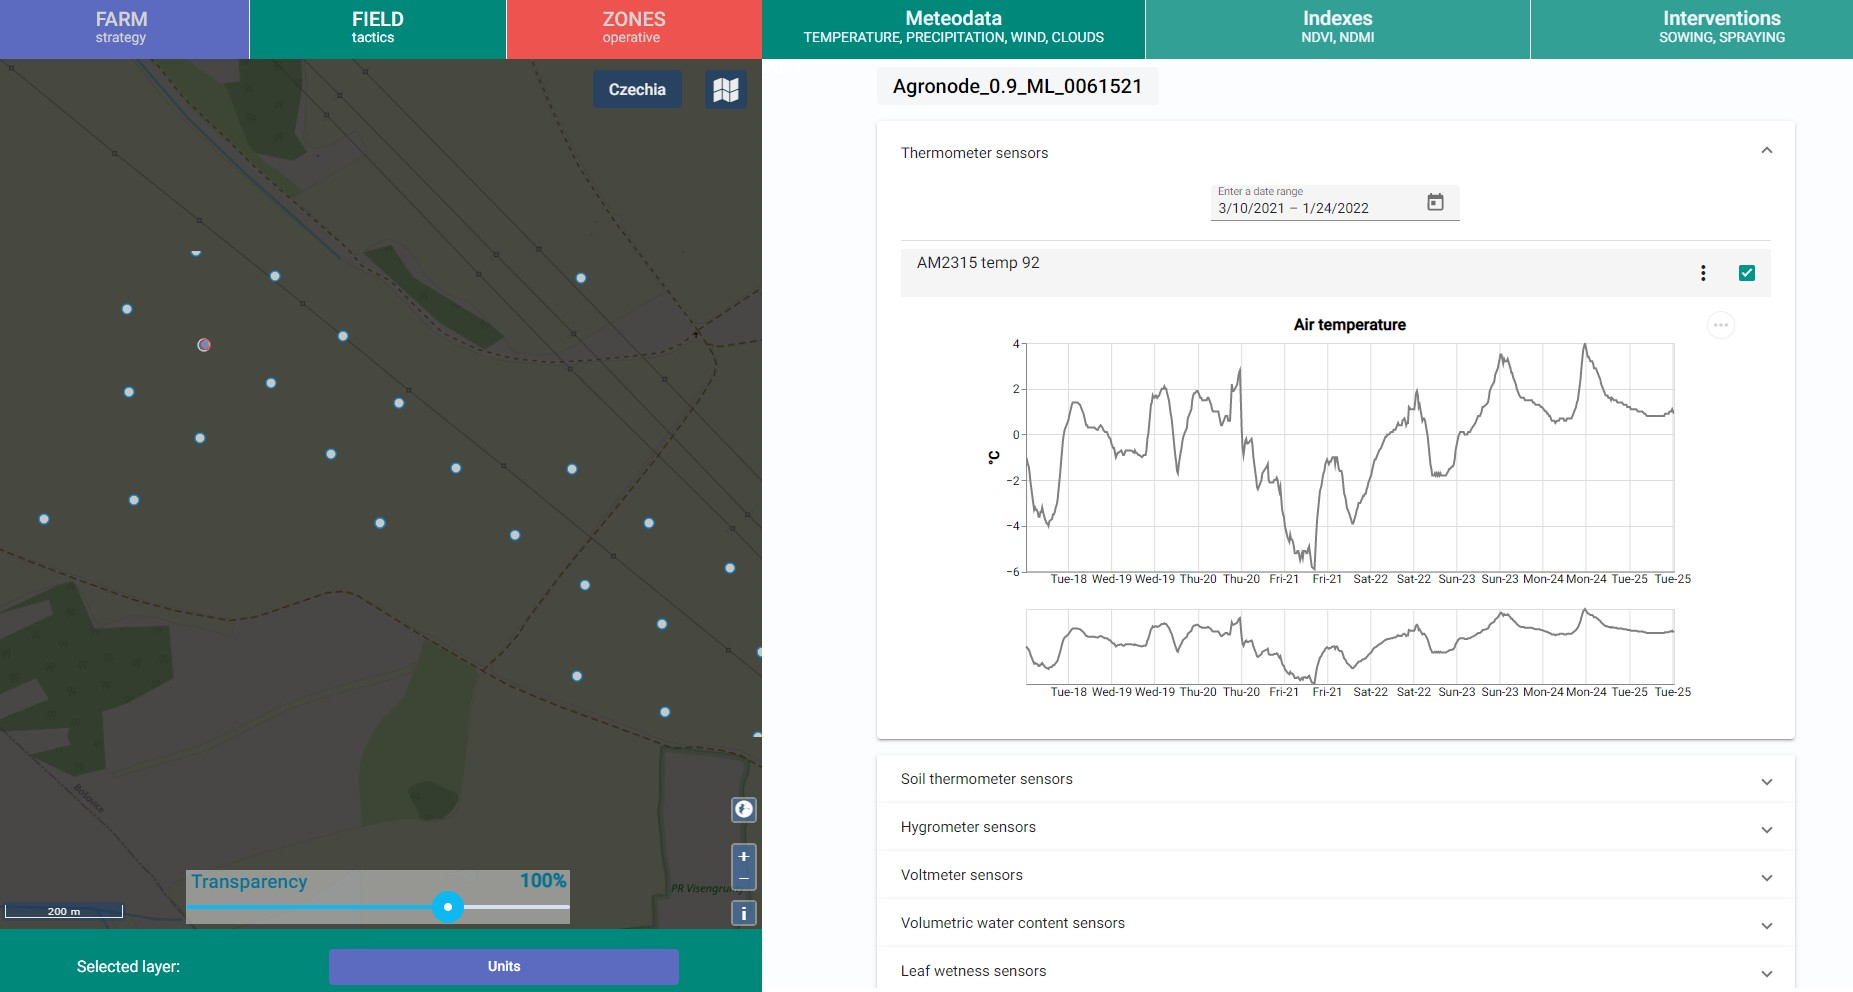
The main services for this module were developed with the CH05 cooperation where tested and provided by the FIE20 application. The visualization of similar data in the FIE20 application is shown in the following Figure.
FINDINGS & CONCLUSION
● Discussion of the results and findings
- As far as the needs of the stakeholders group of farmers, the most important output message is, that there is a solution on the way that will integrate the macro data about climate and weather (Copernicus Emergency Management services including European Flood Awareness System and European Drought Observatory) together with the microclimatic measurements mapping the situation right at the fields/properties of the farmers. The macro data that are to our disposal are going far back to the history of the climate and weather data and, thus, can give to the farmer a good illustration of the possible development during the forthcoming seasons. On the opposite, the micro data we have collected until now are to our disposal only from few experimental locations and, in the case of interest of a farmer to integrate the macroµ data into one coherent system enabling precise prediction of the situation at his fields and property, we would always need to collect the micro data since the very beginning. However, the system is applicable and ready to be used.
- Related to the needs of the stakeholder group of insurance companies, there will be, prior to introducing the combined system of macroµ data measurements to the market, needed to organize an awareness raising campaign focused on presentation of the advantages of the system for insurance companies regarding the simplification of liquidation of insurance actions and prevention of potential insurance frauds, followed by more particular business development negotiations with individual insurance companies. However, the system has really large potential for future simplifying and shortening of the process of liquidation of the insurance actions as well as for making its outputs more reliable for the insurance
- Related to technical part of the challenge, we are now sure that both the systems (macro and micro data collection) are reliable enough and, in the future phases of experimentations on the topic of climate and weather conditions in the fields, we will focus on integration of these two systems into one simple mobile app that would lead to more efficient, secure and economic farming of the future.
● Further improvements
On the level of the two individual monitoring systems (that are planned to be integrated in the forthcoming phases of works), the planned activities are mainly focused on the further integration of sensor data analyses – providing not only visualization of raw resp. aggregated data. But to cover crossing threshold reporting and interpolation of data in map window.
The extension of the farm level of the Info4Agro is mainly oriented on integration of EO data and its processed results (indices, yield management zones evaluation etc.) and involving weather risk analyses.