
FINAL REPORT ON CHALLENGES
#8: How to use and improve OLU 2.0,
#7: OLU4Africa
FINAL REPORT Challenge 7, Challenge 8 [PDF, 10MB]
INTRODUCTION
We introduce two challenges of the Agrihub INSPIRE Hackathon 2022, namely Challenge #8 How to use and improve OLU 2.0 and Challenge #7 OLU4Africa. It’s because these two challenges cooperated closely on their goals. The broad goal of the CH8 is to enhance the established Open Land Use (OLU) 2.0 database with thematic datasets and/or with data from different regions. That is where the goal of CH7 comes handy, because this particular challenge wants to improve a second version of Open Land Use map for Africa (OLU4Africa) primarily with data from ESA World Cover dataset and the OpenStreetMap database.
In the following text, we briefly present OLU 2.0, its capabilities and the way how to use it. Then, we present use cases of the OLUv2 data enrichment both thematically and geographically, namely with data for a particular region in the Czech Republic, Africa and China. Finally, future steps and open questions for further development will be stated at the end of this report.}
METHODOLOGY
The first version of Open Land Use Map (OLU 1.0) was introduced in 2014. Since then, it was a publicly oriented, flat table based, map-centric product containing information not only about land use features, but other information as well. Nevertheless, it had reached its capabilities by incorporating demands and requests about incorporated data and information from its users. Thus, a development of the second version of OLU (OLU 2.0) was started.
The OLU data model 2.0 is a complex database model addressing different requirements for integrating, analysing and data visualisation. The main idea of the OLU 2.0 data model is to flexibly incorporate thematic attributes from different domains by defining a structure of reference geometries and variable adding of attributes to the OLU 2.0 database.
The OLU 2.0 database can flexibly incorporate thematic attributes from different domains by using structure of reference geometries and variable adding of thematic attributes. The extensibility of the attribute part of each OLU feature is ensured by utilisation of a data type implementing the list of key-value pairs to store data. An additional feature of the OLU 2.0 database is ordering of geometries based on levels of details or scales of original datasets. Thematic attributes are linked only to OLU objects defined as reference geometries and according to the order of datasets. This method ensures that attributes are added to features in the same or higher level of detail. In this way, the OLU 2.0 database can aggregate a wide spectrum of additional content. Another feature of the OLU 2.0 database is the utilisation of spatio-temporal thematic views. These views provide an appropriate combination of OLU reference geometries with a defined subset of thematic attributes. Generation of any spatio-temporal thematic view is driven by scenarios or use cases. The data model of the OLUv2 is presented in the first figure.
The OLU 2.0 database comprises data mainly from (Coordination of Information on the Environment) CORINE Land Cover (CLC) datasets containing information about land cover based on the classification of satellite images and Urban Atlas (UA) dataset providing land use maps for over 300 Large Urban Zones and their surroundings. Additionally, where available, Land Parcel Identification System (LPIS) data and cadastral data are also incorporated.
The database can be enriched by multiple regional open thematic data sources. Thematic data can be integrated from different domains e.g., urban planning; soil; topography; climate change; agriculture and rural development. The OLU 2.0 database can integrate EO data and products derived from multispectral satellite images as well. And this is, what the challenges CH8 and CH7 were dealing with.
Particularly, a new approach on creation of OLUv2 objects from Earth Observation data and a world covering database of OpenStreetMap has been proposed and tested in these challenges. The European Space Agency has published the WorldCover dataset in 2021 with a 10m resolution, which will be used together with OSM to create an OLU map of a particular region, where no more detailed datasets are available. The algorithm itself is described by examples in the Results part of this report.
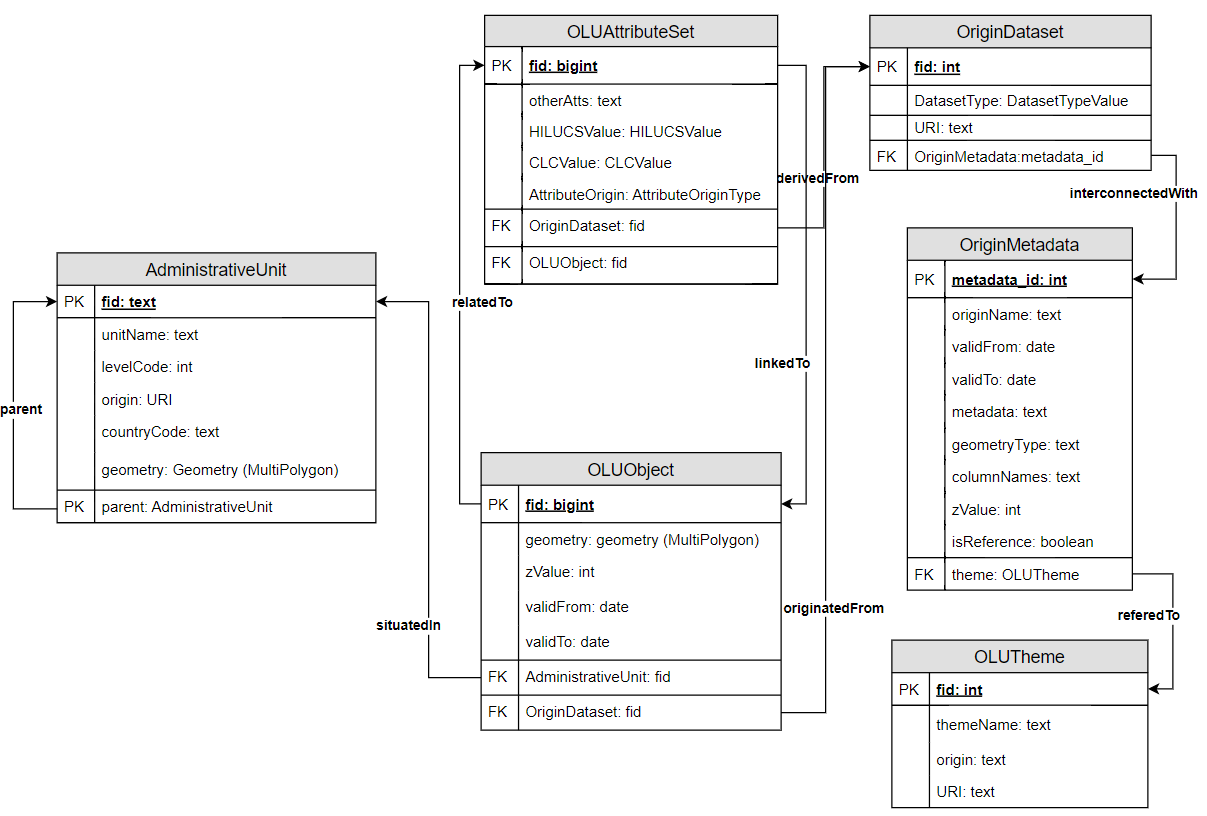
OLUv2 data model.
RESULTS
In this section, there are examples of incorporating thematic layers into OLUv2 database for particular geographical locations and thematic data not yet implemented in the OLUv2 database:
- Rostenice Farm (Czechia) with soil-related data;
- Pilot sites of the SIEUSOIL project in China with soil-related data;
- Second version of the OLU4Africa extended for the whole continent with ESA World Cover and OSM data on SmartAfriHub.
Results for the Rostenice Farm
Due to the fact that we collaborate a lot with the Rostenice farm organisation, there already had been integrated a number of thematic datasets (except main land use and land cover themes), namely:
- EVI index in Vyskov lokality at 2020-04-22
- Sentinel-2 based classification 2020
- Sentinel-2 based unsupervised classification 2020
- Sentinel-1 and Sentinel-2 based combined unsupervised classification 2020
- EU DEM (topographic characteristics: elevation, slope, azimuth, TWI)
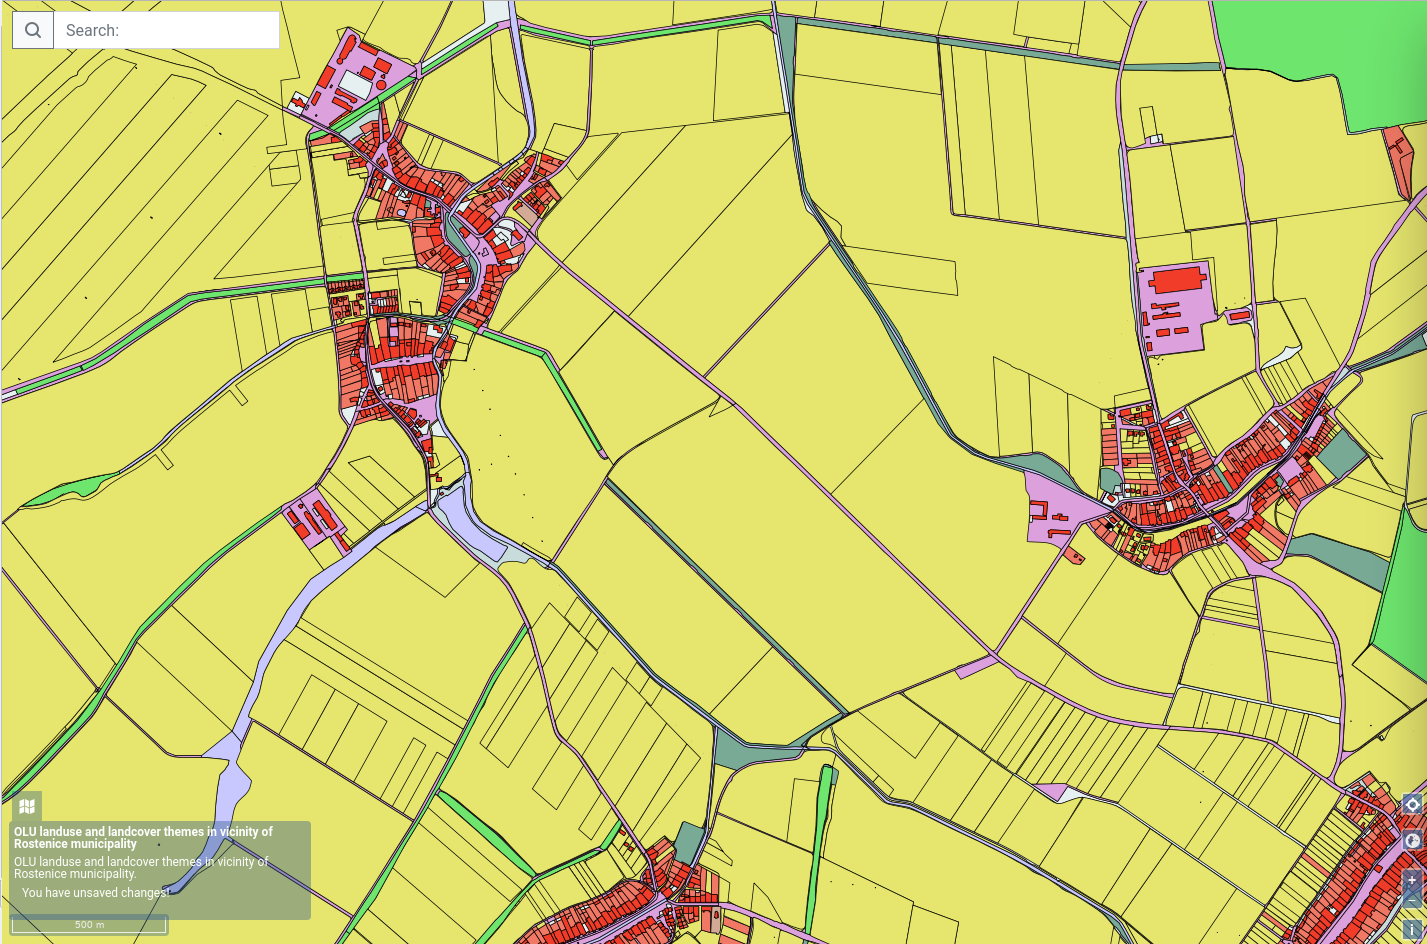
Location of Rostenice (CZE) – land use theme in OLUv2
Newly, thematic data about particular soil qualities have been incorporated from ISRIC Soilgrids, namely organic carbon stock, organic carbon density, total nitrogen and soil pH.
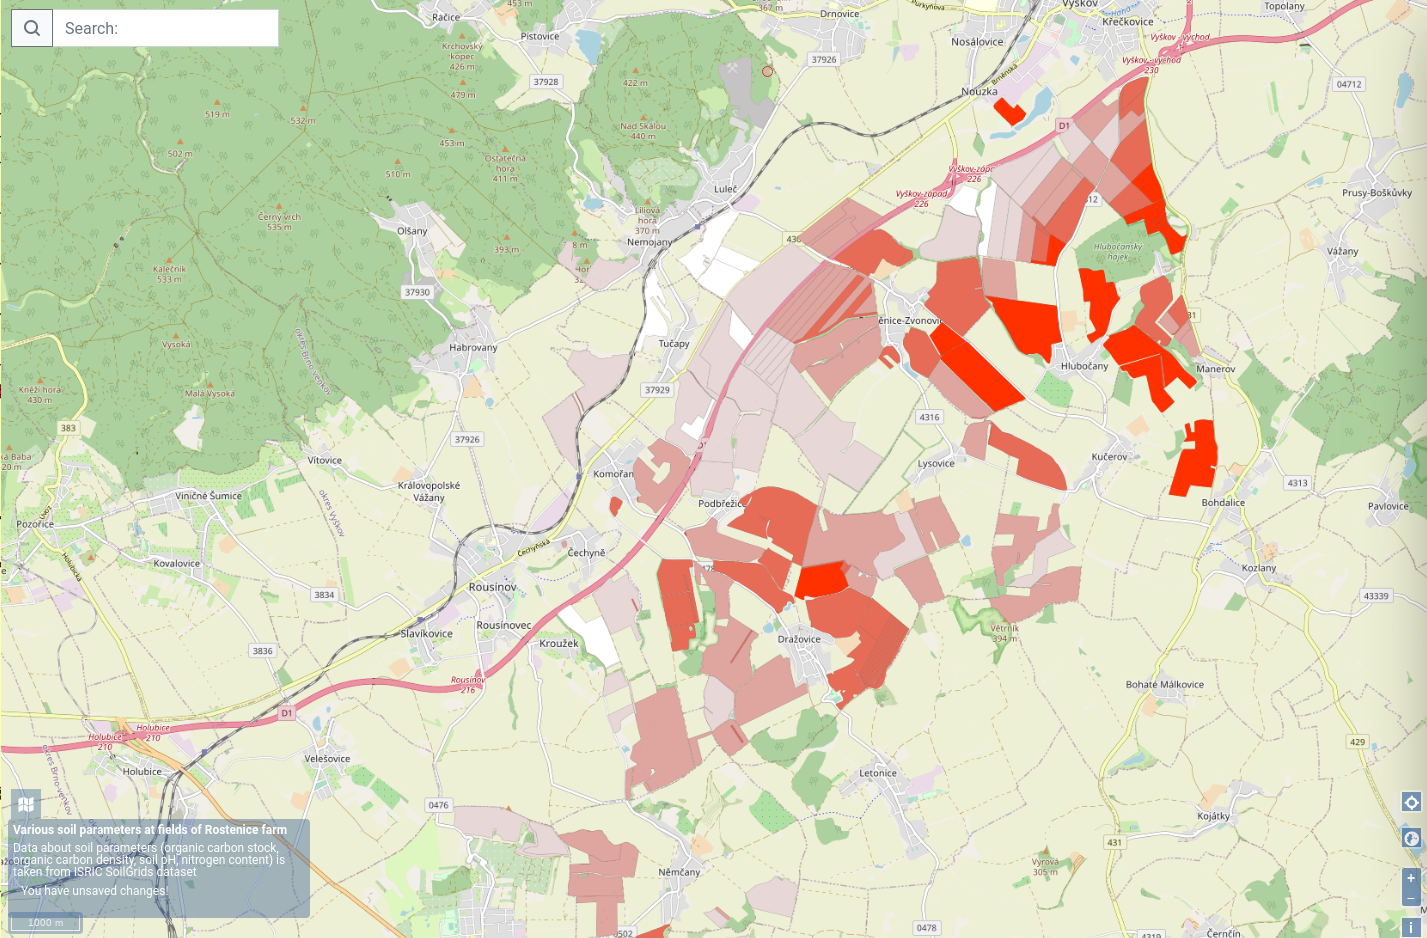
Organic carbon stocks in soil surface layer at fields of Rostenice farm integrated in the OLUv2
Due to the fact that the farm is quite advanced in using methods of precision agriculture and information systems as well, the level of detail (on the level of the single field) is not sufficient in many cases for their purposes. So it is needed to build a bridge between OLU (that contains fields) and computation of finer zones (e.g. management zones). This, however, shouldn’t underestimate the value of OLU, because the field parameters and statistics are very important for planning and evaluation of farming activities. This bridge (computation of management zones on a field from OLU) is just a logical step forward. One possible solution for this is to integrate OLU thematic data into applications like FieldCalc (Challenge 11 of this competition), which calculates management zones of the fields based on EVI index. It would be nice if together with actual management zones, a user would get other thematic data about the fields. Possibly it could help certain decision making tasks.
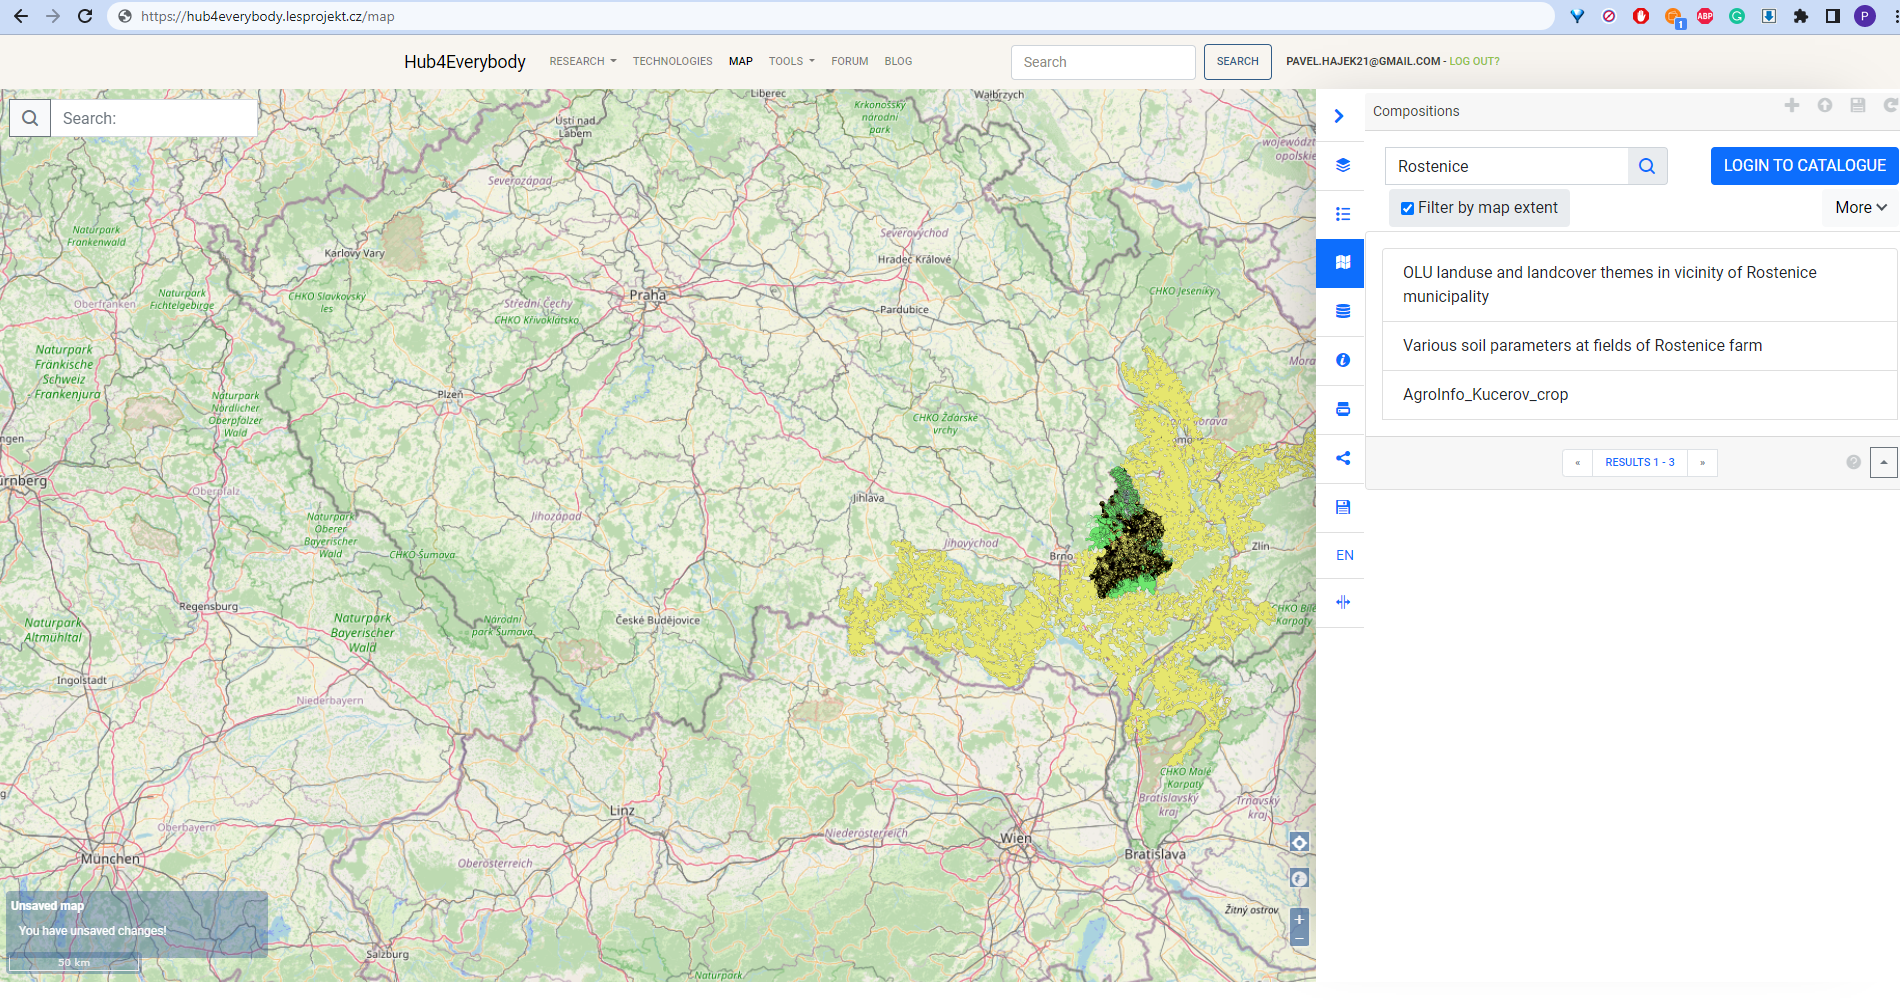
Map compositions showing presented data from Rostenice farm is available on https://hub4everybody.lesprojekt.cz/map/, namely as:
- OLU landuse and landcover themes in the vicinity of Rostenice municipality
- Various soil parameters at fields of Rostenice farm
How to find such compositions on the Hub is depicted in the following figure.
Results for the China’s pilots of the SIEUSOIL project
In China there are 4 pilot sites of the SIEUSOIL project:
- pilot 8 (in Hebei)
- pilot 9 (in Heilongjiang)
- pilot 10 (in Jiangsu)
- pilot 11 (in Xinjiang)
Due to the lack of local data, an approach to use a combination of data from OpenStreetMap (OSM) and European Space Agency (ESA) World Cover was used.
At first, the OSM data and World Cover raster was downloaded for the 25 km vicinity of a pilot. After that the linework with selected attributes (that could indicate division of space into different land use) was selected from OSM data and also borders of vectorized features of ESA World Cover. After that this linework was polygonized and dumped into polygons. In the final step, the land cover category of each resulting polygon was detected again from the World Cover data.
After this initial preparation, the agricultural areas could be selected and attributes that indicate soil quality (organic carbon stock, organic carbon density, total nitrogen, soil pH) for different soil depths, could be added from ISRIC SoilGrids dataset.
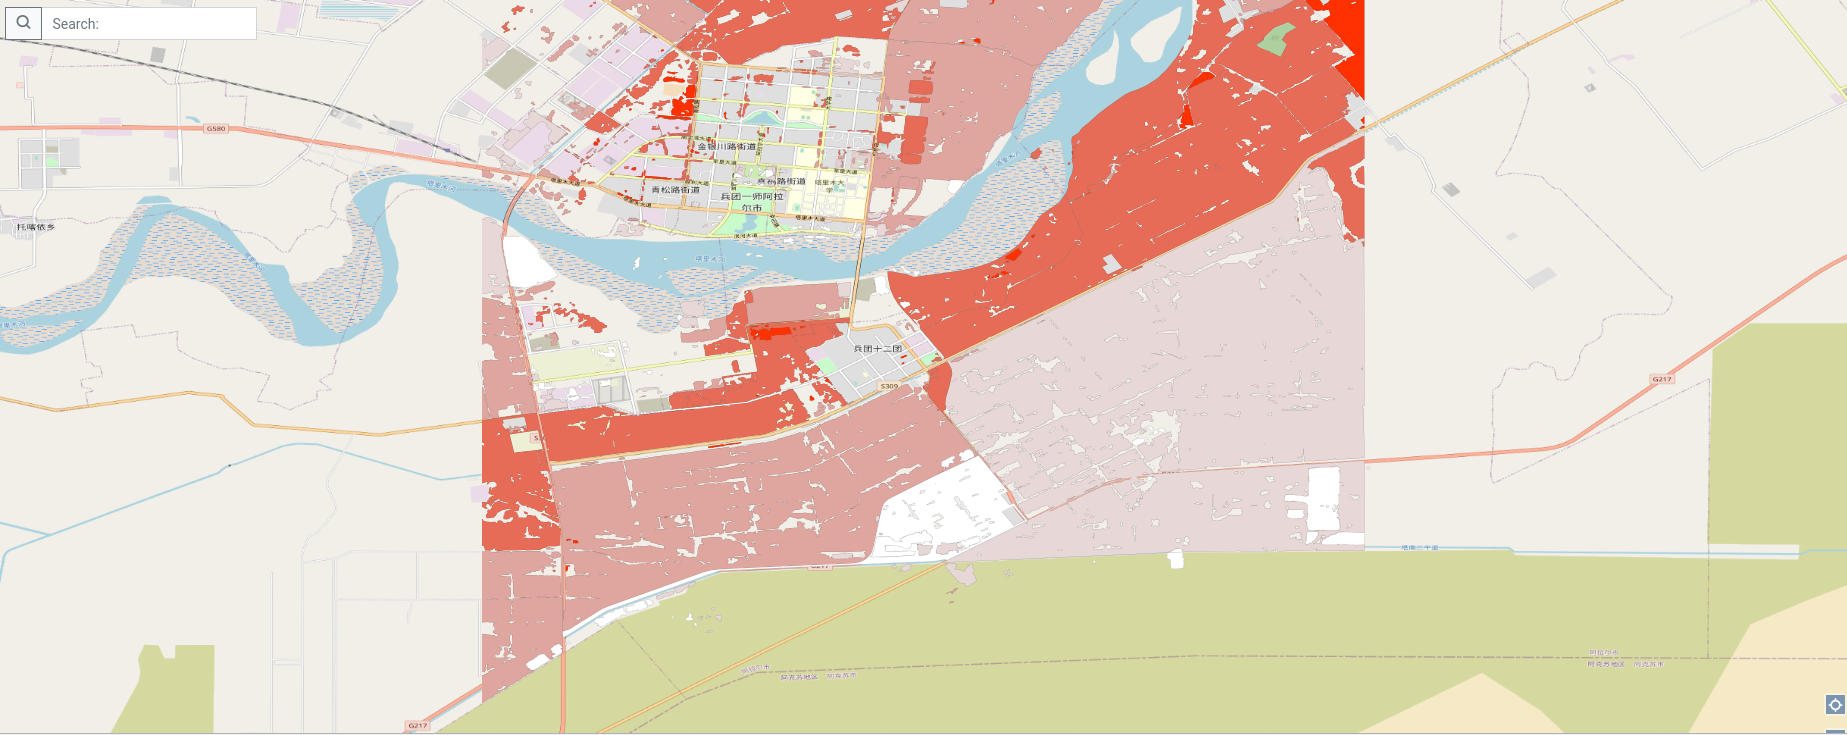
Organic carbon stocks in vicinity of pilot 11 (Xinjiang) of the SIEUSOIL project
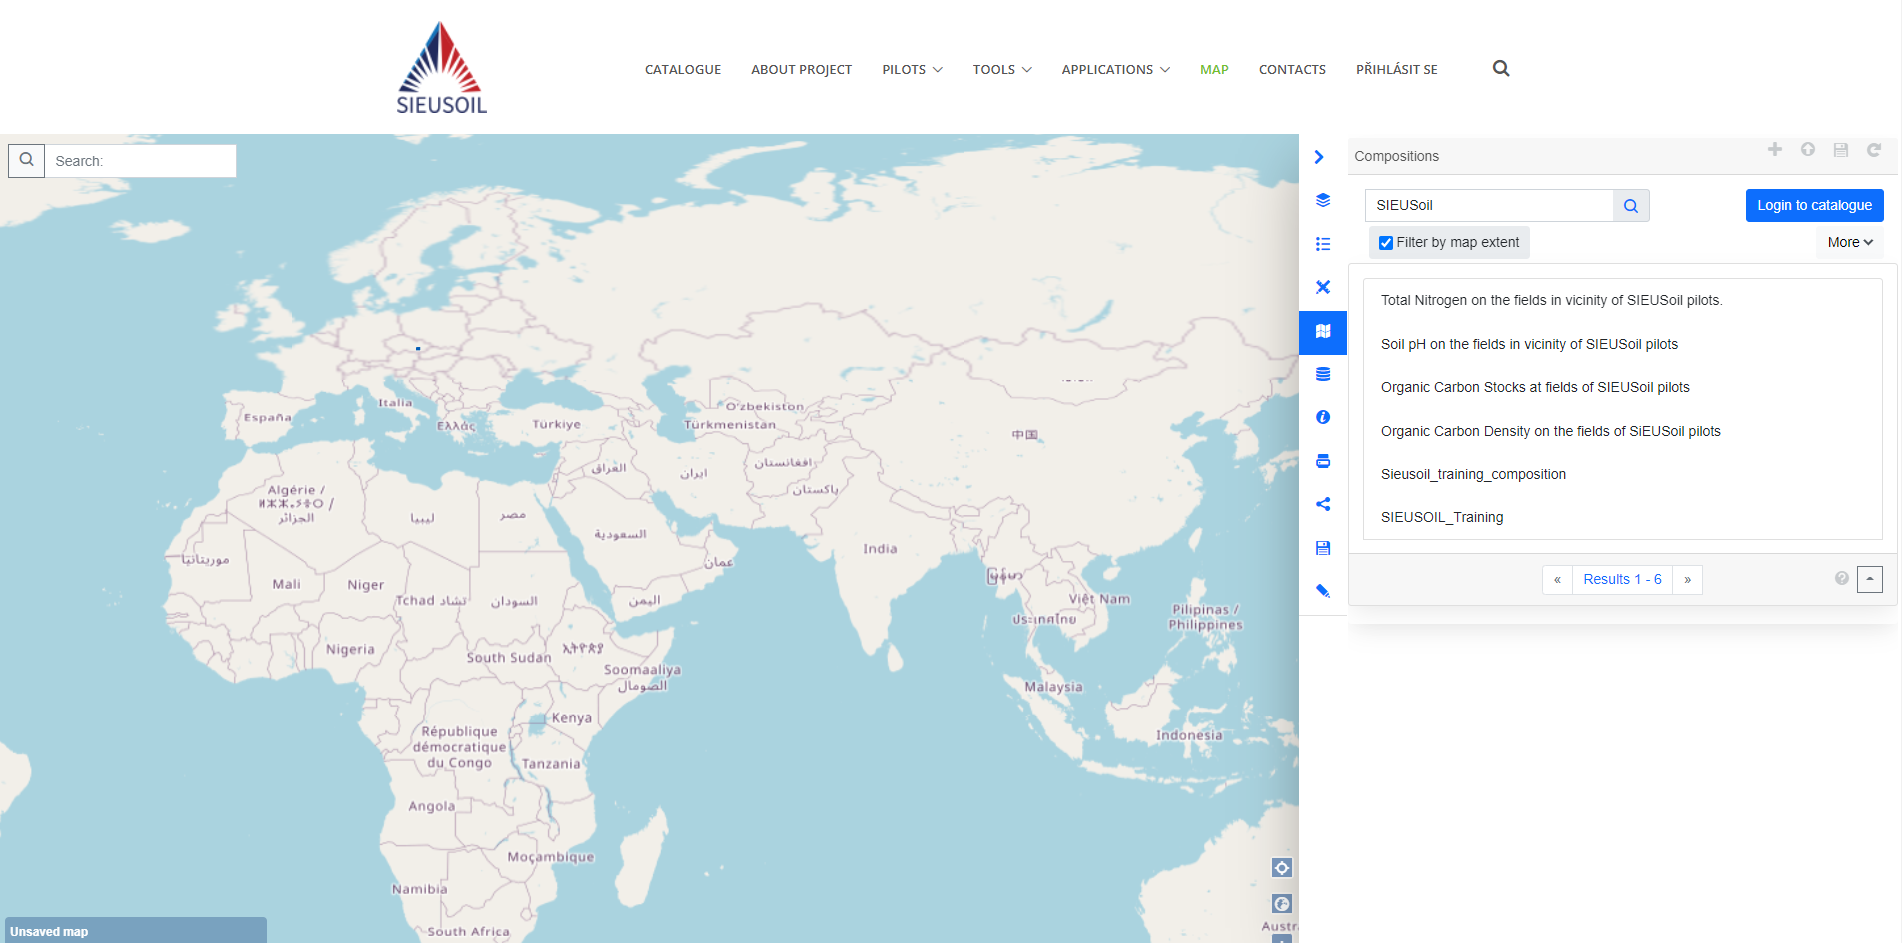
Map compositions showing presented data from China is available on https://hub.sieusoil.eu/cs/main-map, namely as:
- Total Nitrogen on the fields in vicinity of SIEUSoil pilots.
- Soil pH on the fields in vicinity of SIEUSoil pilots
- Organic Carbon Stocks at fields of SIEUSoil pilots
- Organic Carbon Density on the fields of SiEUSoil pilots
How to find such compositions on the Hub is depicted in the following figure.
Results for the OLU4Africa
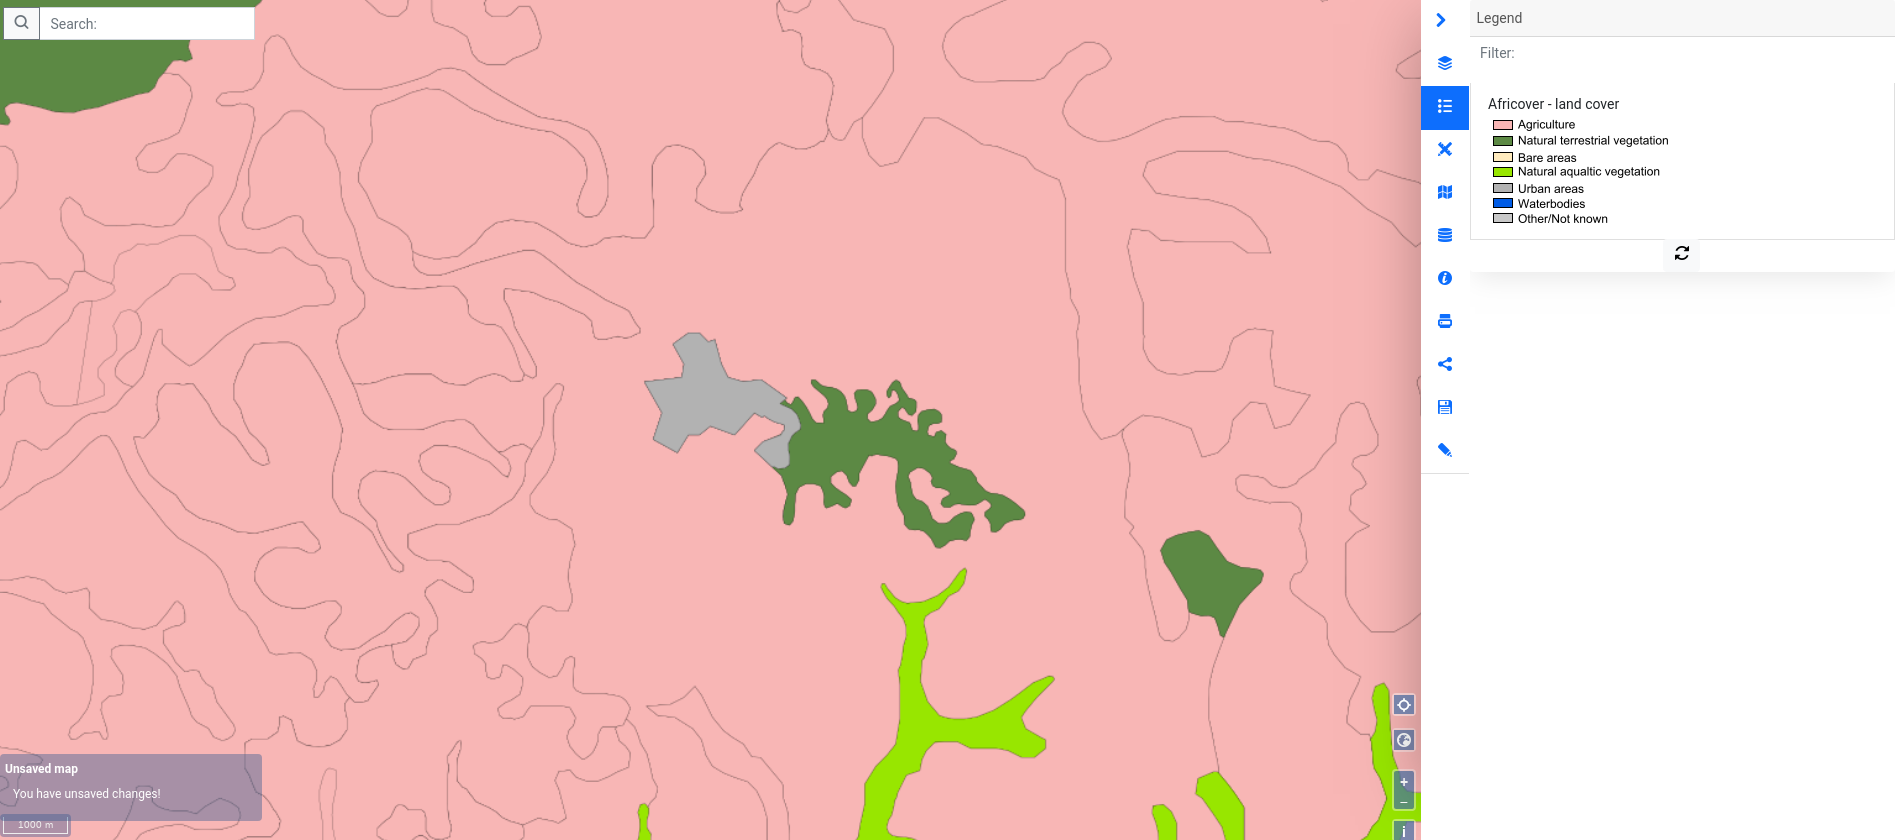
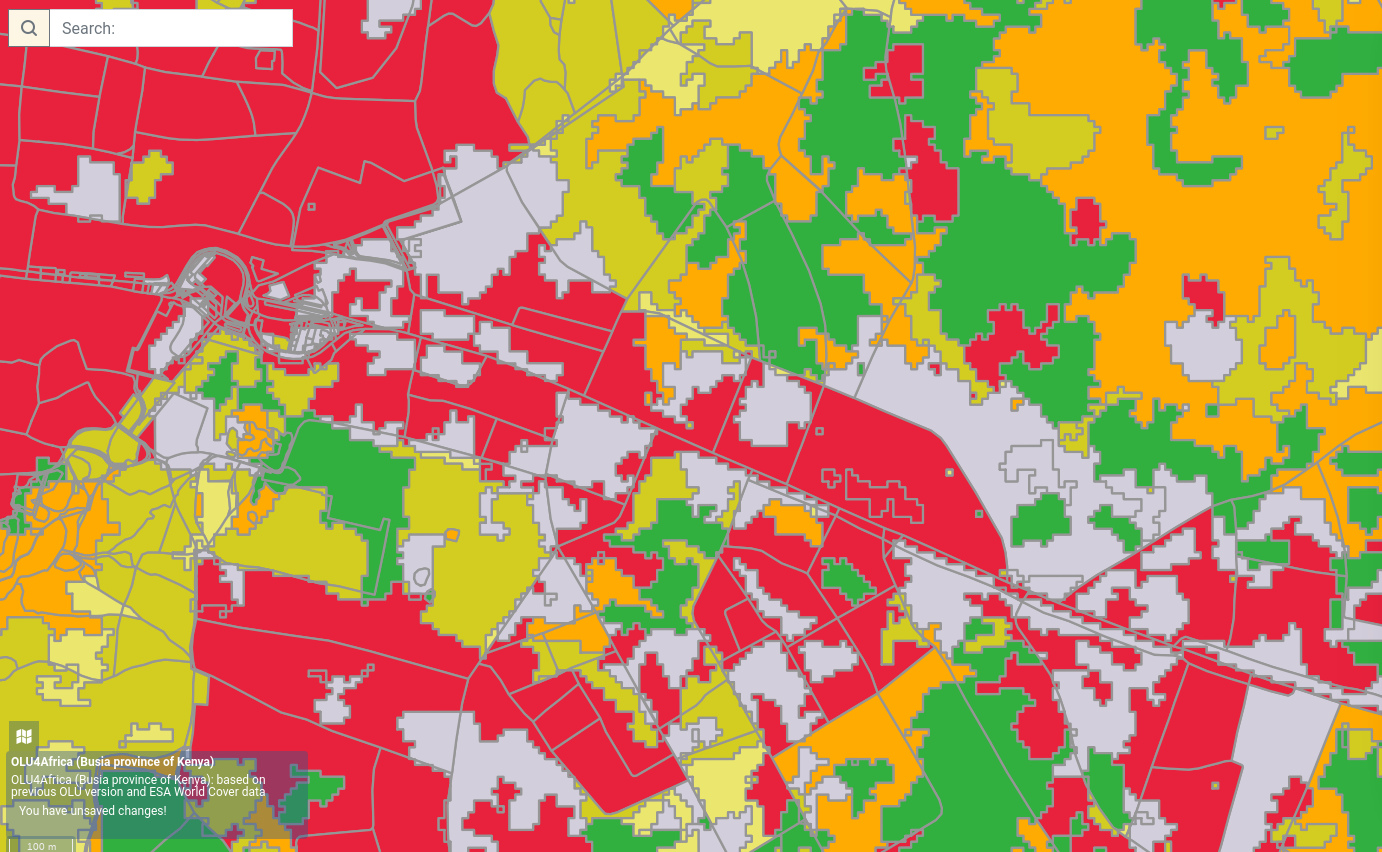
At first, back in 2018 we were starting based on Africover dataset and selected polygons from OSM that had attribute landuse filled. To demonstrate how polygons in Africover look – here is the extract that shows Busia city on the border of Kenya and Uganda. Besides poor spatial resolution, the dataset is also outdated – for Kenya it was published in 1999.
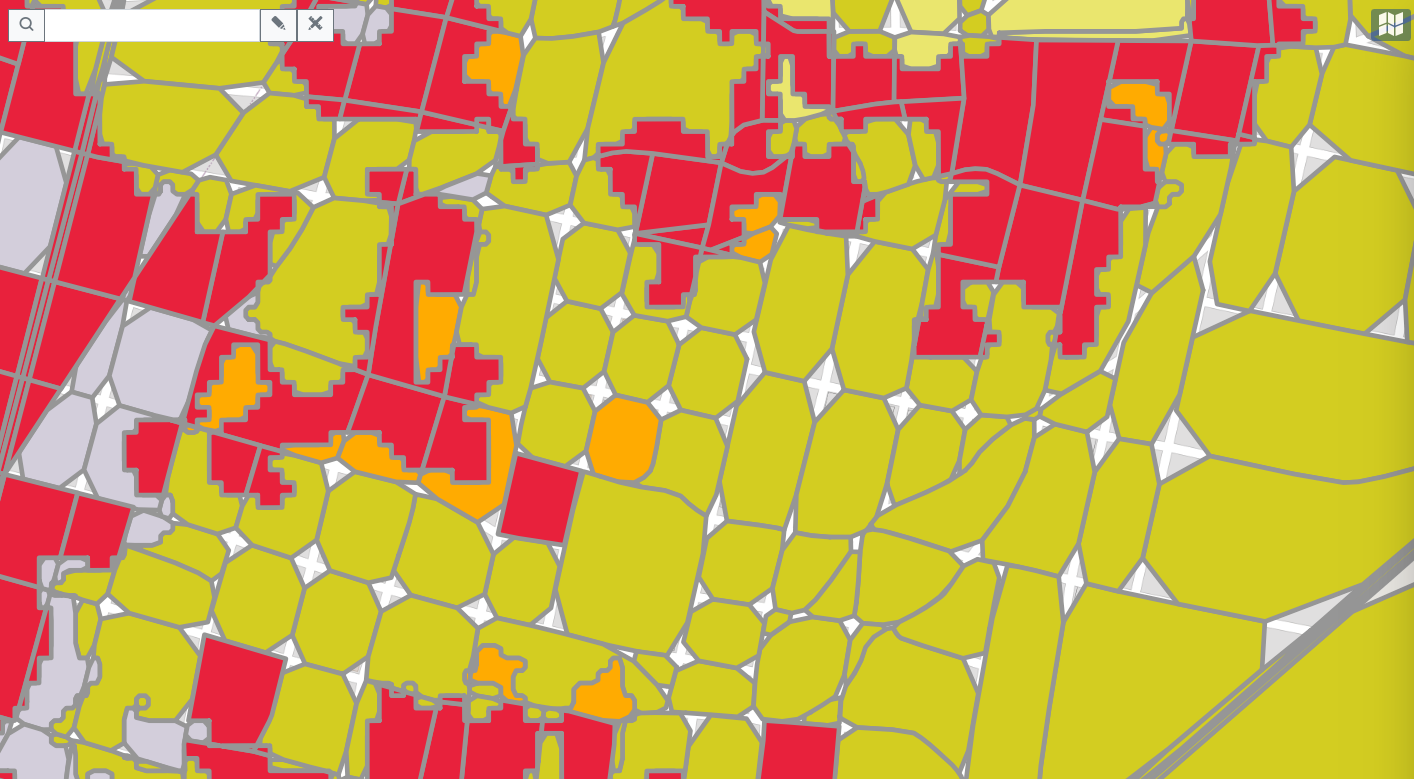
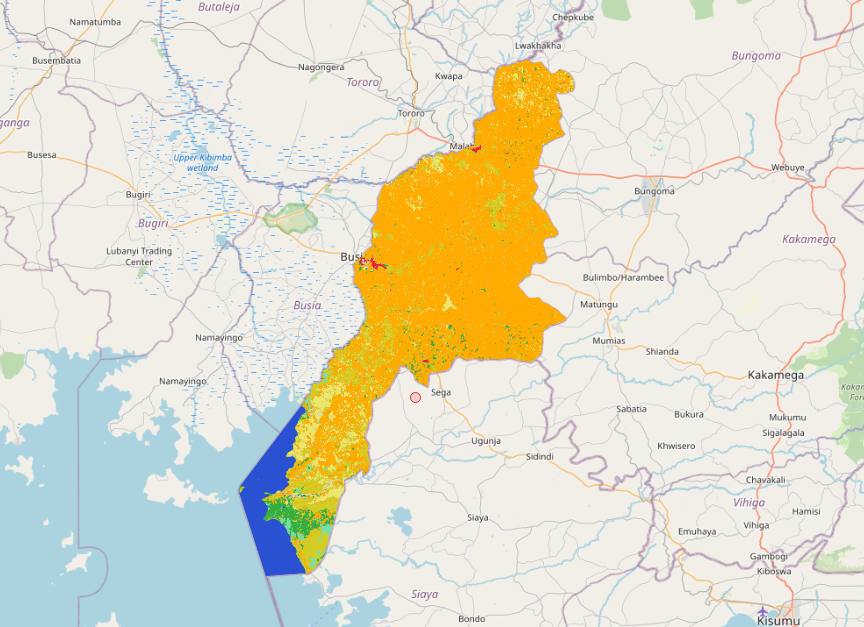
In the second version of OLU4Africa it was decided to take the relevant linework (lines and polygon outlines) that have attributes indicating that those lines could partition space into different types of landuse/landcover (for example, river, road, forest boundary, and not features like electrical lines, subway, bridges etc.). After the reference geometries were created using method of polygonizing linework and dumping polygons, the land cover type was added from CCI 2016 Landcover 2016 dataset using raster statistics methods (for each feature, the raster was clipped by feature’s geometry and most prevailing pixel value was assigned to the feature).
The result already looks much better:
However, there still have been some empty areas, which are not at all mapped by OSM (mostly those are sparsely populated areas in desert/rainforest). And at the end of last year – ESA published a new global world cover dataset, the ESA World Cover. It was decided that this time – in addition to OSM linework – also vectorized features from ESA World Cover will be used. There were lots of hardships with that. The dataset is global and has resolution 10 meters, so it is not provided as a single raster – but 3×3 degrees tiles that are accessible through API. So the work was done – to set up downloading the data through API, moreover if OLU administrative unit falls into different tiles – several tiles are downloaded and merged together automatically. After that it was lots of work selecting the vectorization method. Several was tested but none gave fully satisfactory result:
- the simplest one – that vectorizes features by pixels is generally usable but has some issues such as the result doesn’t look realistic and has many more points than it is needed:
Then it was tried to smooth using Chaikin smoothing the borders of the features but it has caused the tears in those places where lineworks intersects at straight angle (typically street intersections):
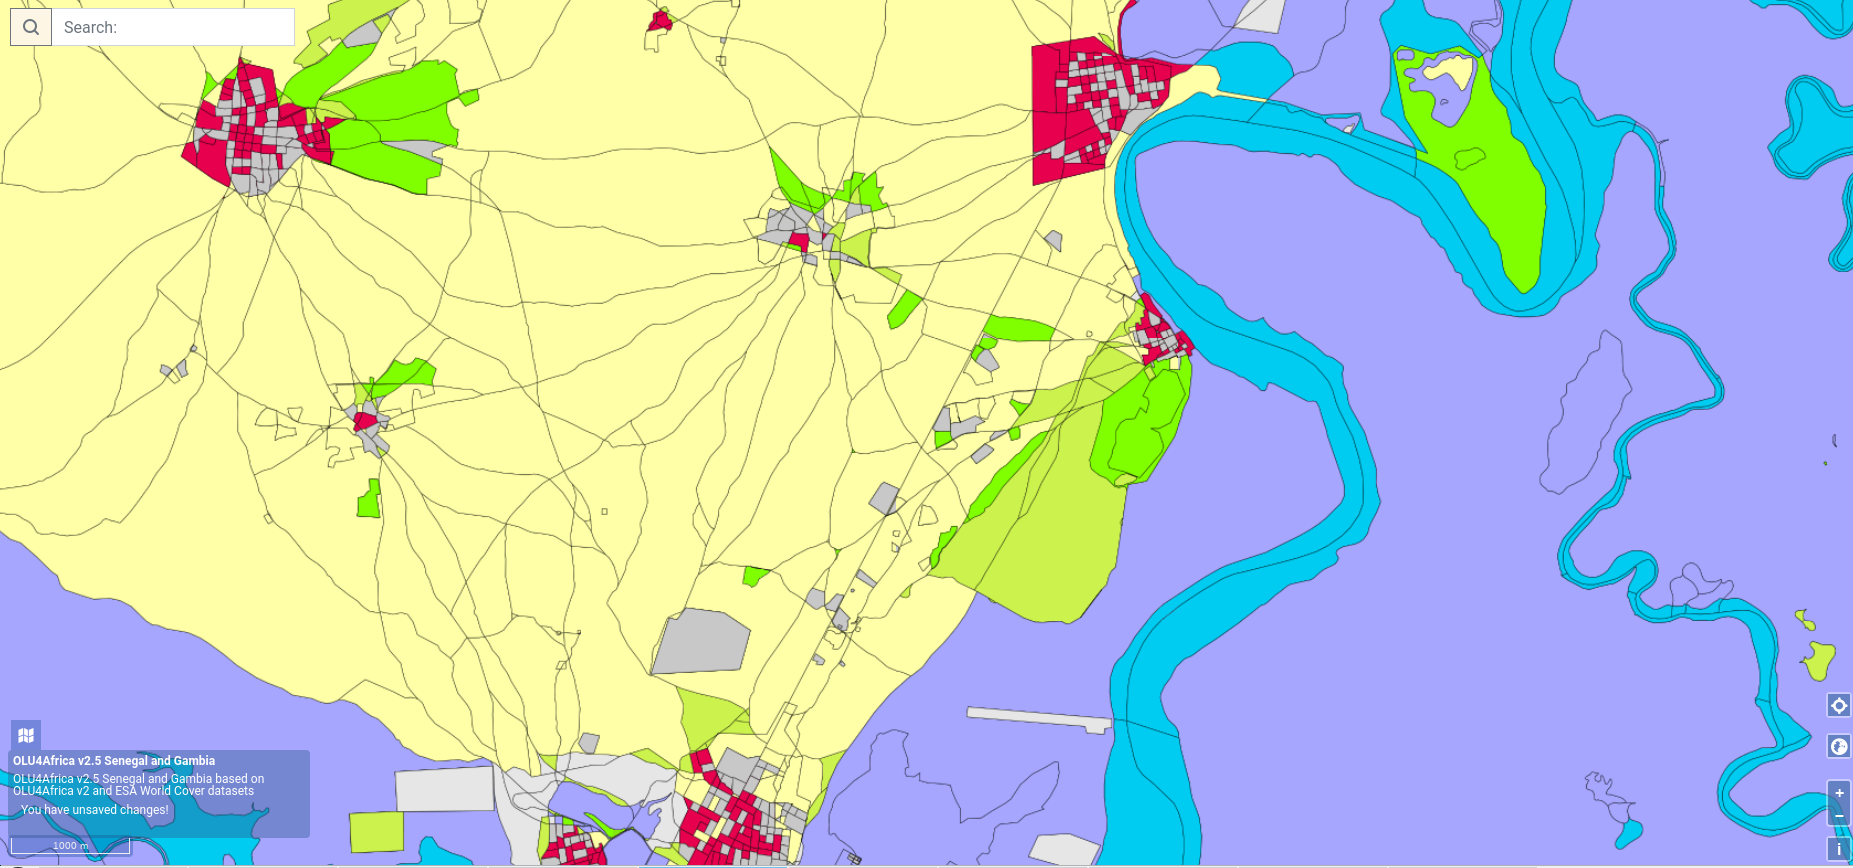
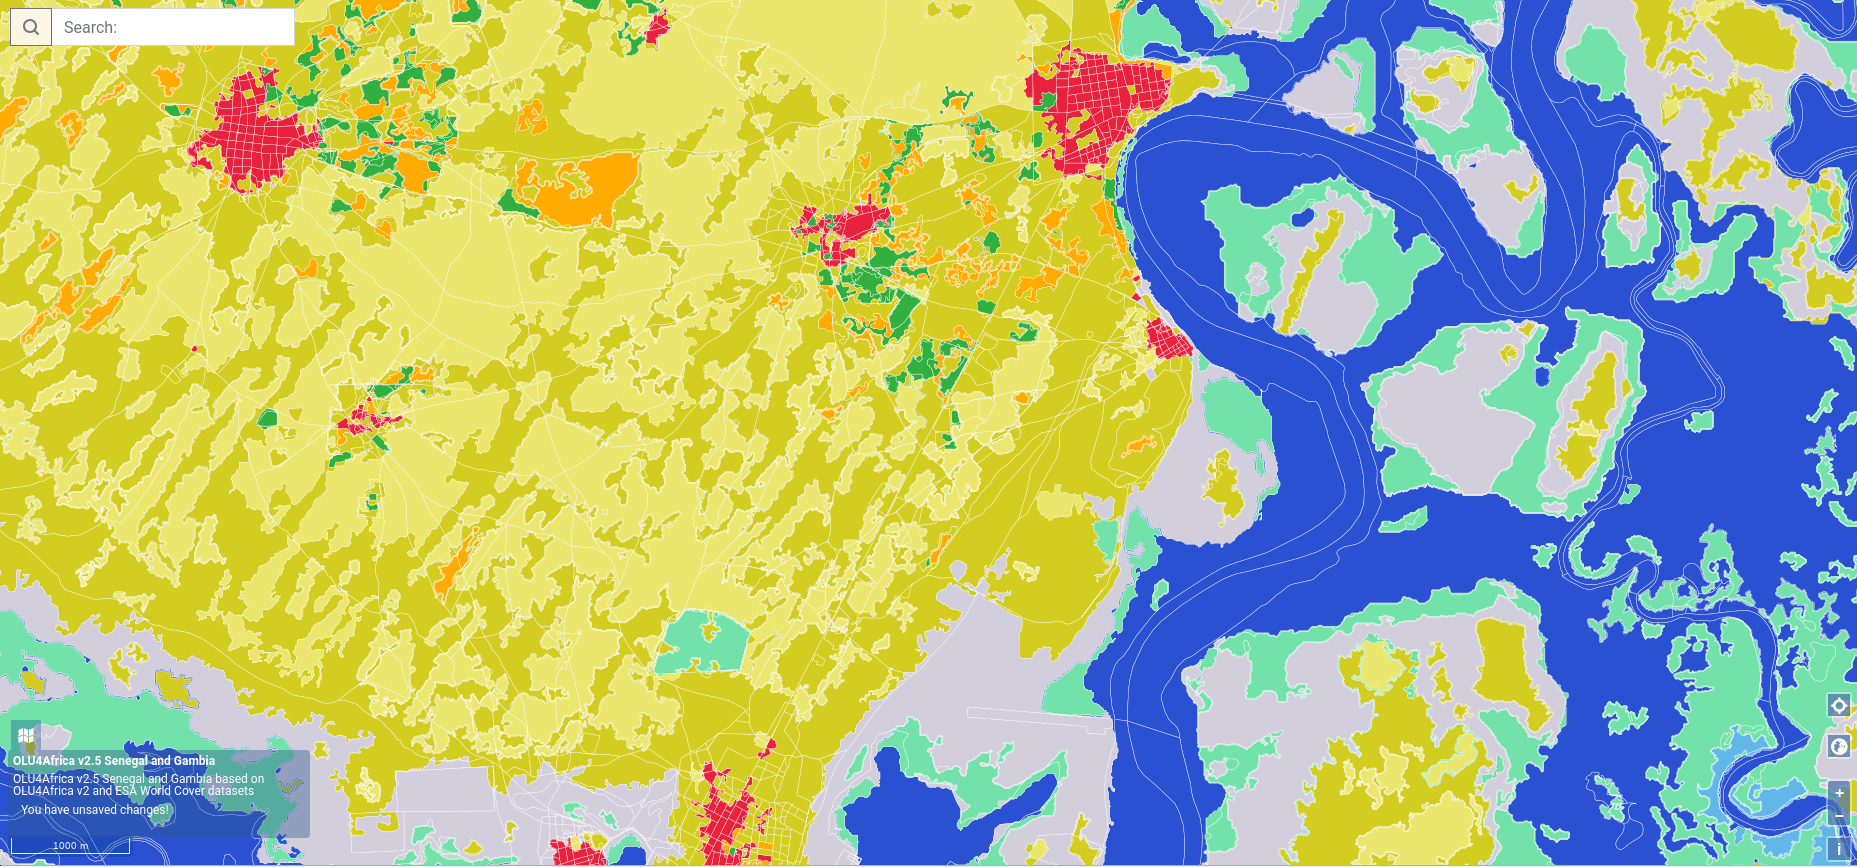
- Then except those methods it was tried to use contour lines method. At first, the contour lines were created using gdal function ContourGenerate (https://gdal.org/python/osgeo.gdal-pysrc.html#ContourGenerate). After the resulting line work together with the features from previous OLU (that consisted of OSM linework) was polygonized and dumped. The land cover class was decided based on raster statistics and at first glance doesn’t look bad (tested at Senegal and Gambia):
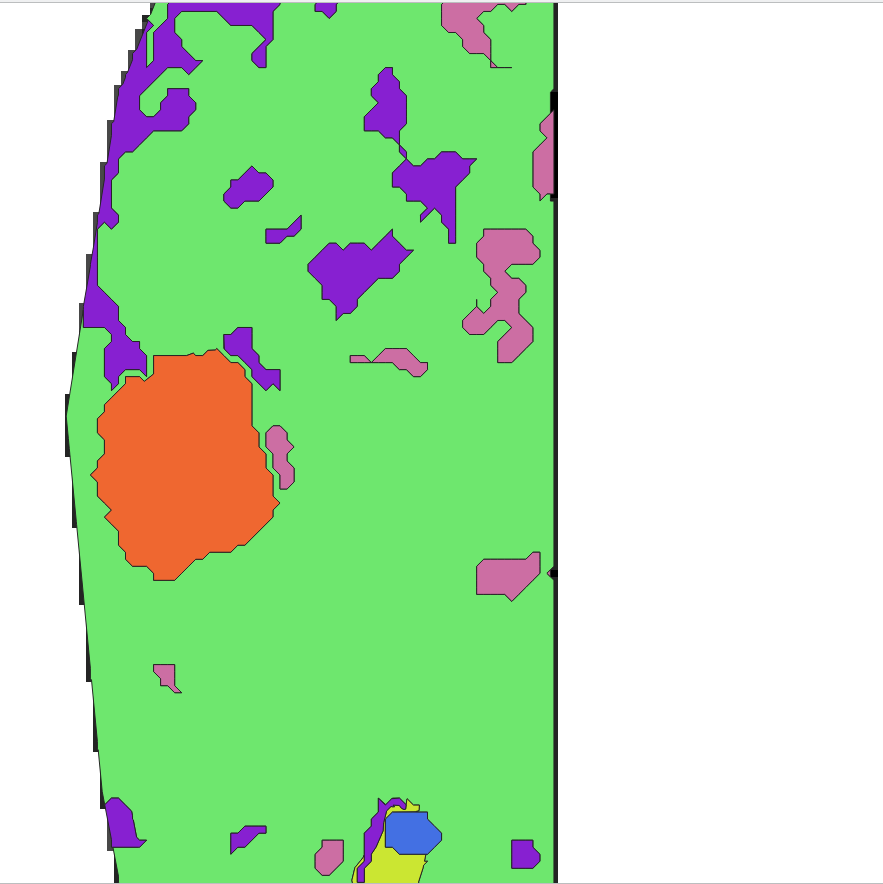
After zooming in however it appeared that there are some errors caused by the nature of the contour generating algorithm. The problem is illustrated by the following image:
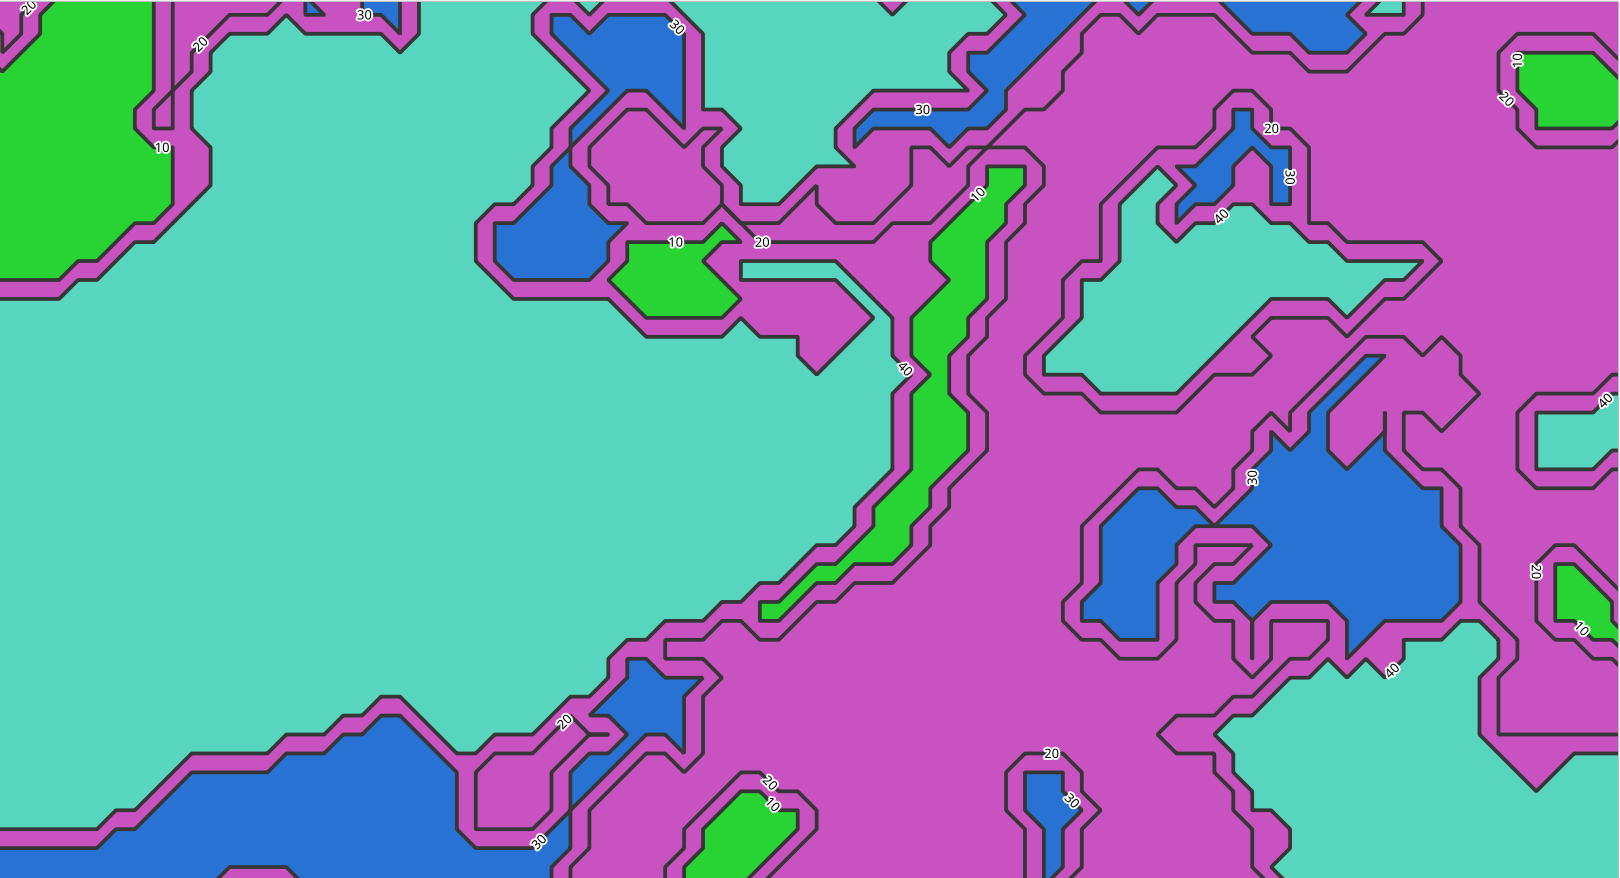
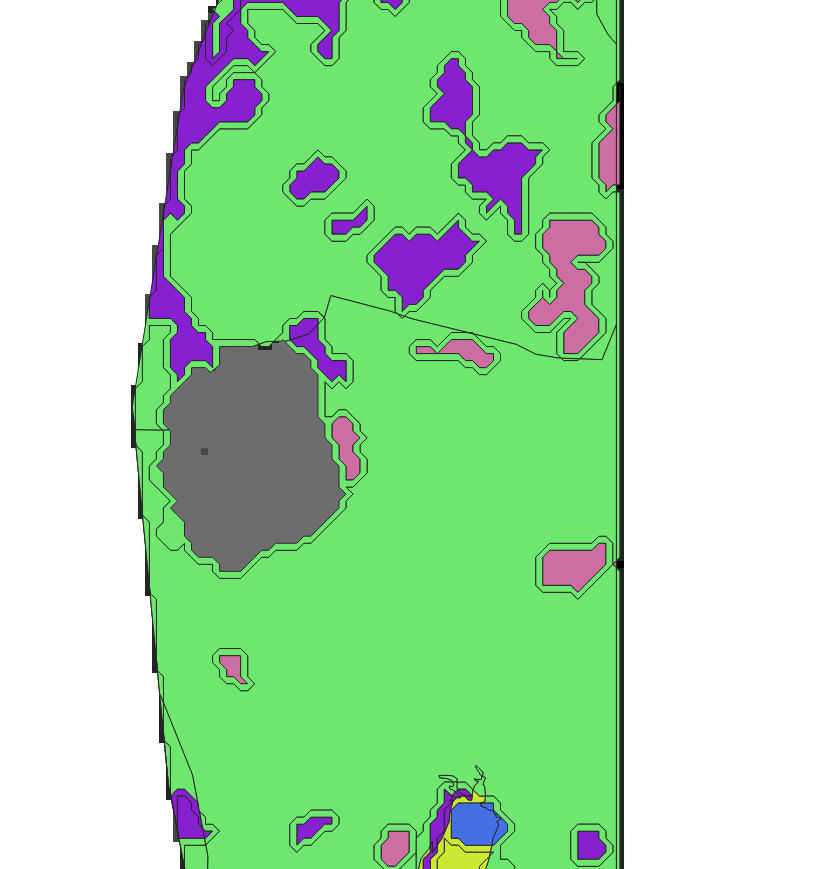
It looks like the contour lines are going through the centers of the neighbouring pixels, belonging to the different land cover types. Thus the area in between two center pixels is looked as a transition area ––buffer zone. In case if this transition zone is just in between two land cover types and the most prevalent pixel type belongs to one of those 2 – this could be solved by merging neighboring areas that have the same land cover type. It is demonstrated by the next two images:
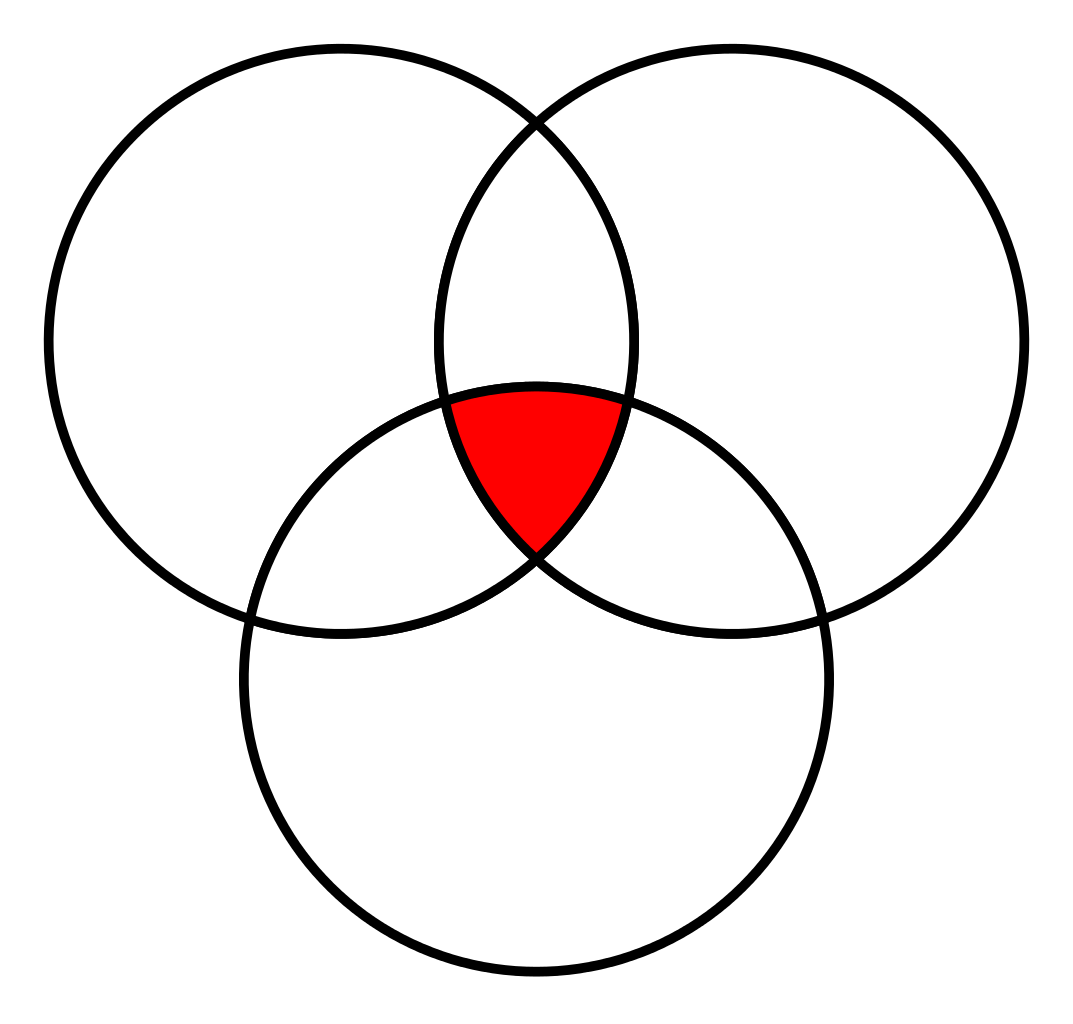
However, if it is situated between three categories or if the most popular pixel value in it – is third (not one of those neighboring), then it is a problem. In the case of neighboring three categories – it is possible to split it into four parts (AxB, AxC, BxC, AxBxC) as in the following image, and then classify each of them separately. This method was tested on small areas (up to 100 features) and works, but it is impossible to imagine how much time it will take to do this for bigger areas.
Another problem is the nature of ESA World Cover data. It comes from satellites and the state depends on the season and also the quality of the classification algorithm. Here is an example from the border between Kenya and Uganda:
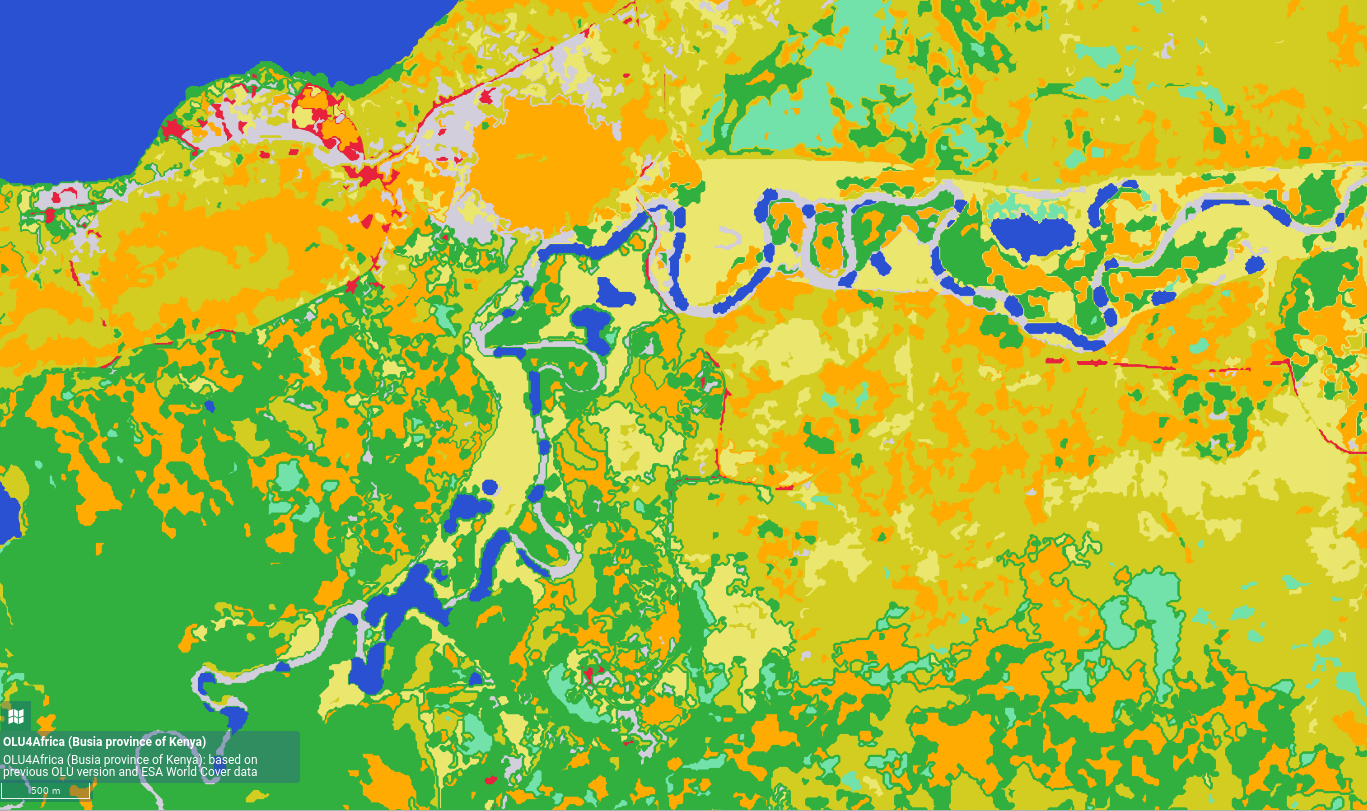
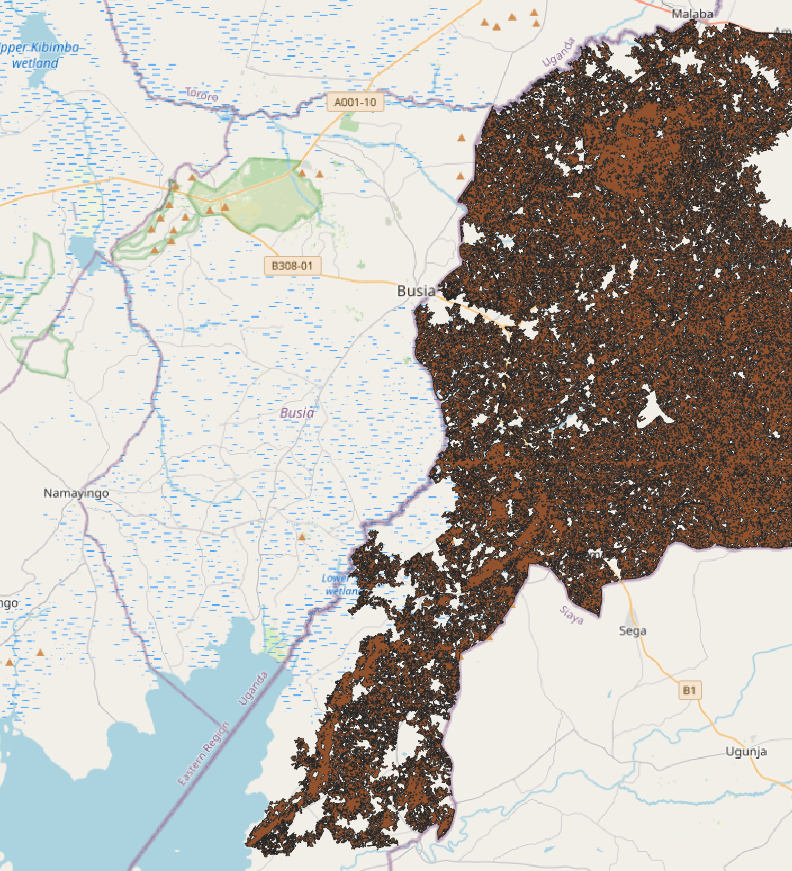
Here it is seen that parts of the river are classified as water and parts as a swampy area. But probably the most important hardship and limitation is data size. For instance, if we assume that we work just with middle sized Kenyan province Busia (lies on the border between Kenya and Uganda).
If we draw a bounding polygon around it it won’t be bigger than 100x100km. But already it is impossible to run vectorization all at once (at the server used for the hackathon). In order to do this the area needs to be divided at least by 50x50km data tiles. And even with this division the vectorization, detecting land cover and merge of neighboring polygons with the same category lasts around 20-30 minutes. The image above consists of 4 data tiles with a total sum of about 100 000 features. Moreover as a result, there start to exist continuous areas with huge area and number of nodes, that are then difficult to visualize, see shrub area on the next image:
So, probably, to do this for the whole Africa would take an immense amount of effort, time and space on the server. And in the end it will be impossible to render it fast, so it couldn’t be seen seemelesly by a user.
Probably, the solution here is to go in the direction of providing an option of World Cover digitization as a service. Where a user will have some practical reason behind it. If the area in which the user is interested is less than 50x50km it is possible to run this digitization based on the World Cover dataset in less than 10 minutes.
Additionally the data that is being prepared could have been enriched with other thematic attributes from APIs connected (for instance, ISRIC SoilGrids etc.) and further could be used by that user for his own analysis, he is interested in.
As a conclusion could be said that there needs to be some planning about what thematic datasets to incorporate and how to provide OLU4Africa to the users. And probably, in the first place to decide and find users.
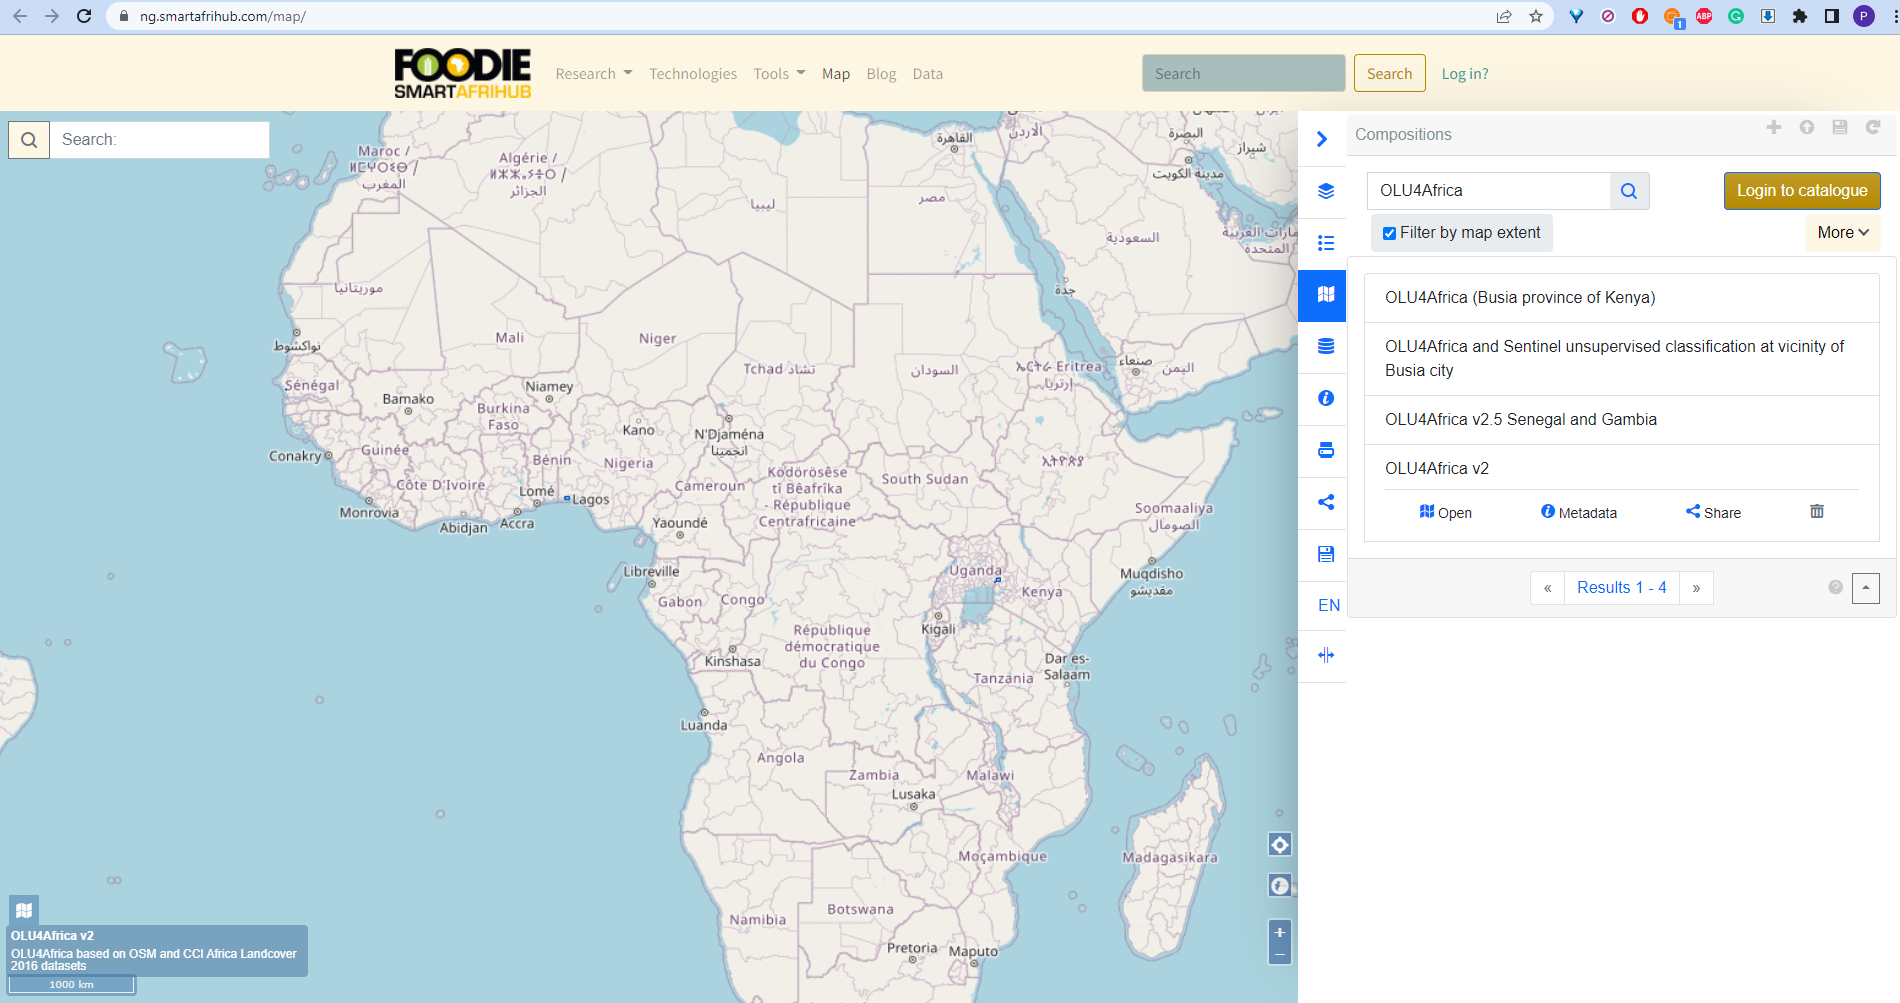
Map compositions showing presented data from OLU4Africa is available on https://ng.smartafrihub.com/map/, namely as:
- OLU4Africa (Busia province of Kenya)
- OLU4Africa and Sentinel unsupervised classification at vicinity of Busia city
- OLU4Africa v2.5 Senegal and Gambia
- OLU4Africa v2
How to find such compositions on the Hub is depicted in the following figure.
FINDINGS & CONCLUSION
This report presented achievements from Challenges 8 and 7. It showed particular results, such as that the concept of OLUv2 has been proven by extending its content by enlarging the contemporary content of the OLUv2 database from Africa (CH7 goal) and by adding additional thematic datasets from different regions (CH8 goal).
An algorithm for incorporating ESA World Cover raster dataset and OSM vector database into the second version of the OLU4Africa was proposed, but not yet fully tested to be feasible for large areas.
A further development will be related to improving the proposed algorithm for generating OLU objects from ESA World Cover and OSM datasets, an incorporation of other types of data, such as sensors/IoT-related ones to create a very comprehensive hierarchical database containing as much data of high value as possible. Then of course, there will be work on availability, fluentness and speed of the providing data from OLUv2 database, while the final version of the database is supposed to cover the whole world.