
FINAL REPORT ON CHALLENGE #12:
Building a map based social space for Africa
Name of mentor(s): Akaninyene Obot, Markéta Kollerová
Number of participants: mentors + František Zadražil + 6 registered participants
- Webinar Hub4Everybody – 120 registered participants, geographically spread throughout the whole Europe, then Africa, South America and also Asia + 136 views on Youtube
- Training session SmartAfriHub vol. 1 – 13 participants + 62 views on Youtube
- Training session SmartAfriHub vol. 2 – 7 participants + 18 views on Youtube
FINAL REPORT Challenge 12 [PDF, 5,5MB]
INTRODUCTION
Background of the challenge
During last year’s INSPIRE Hackathon the SmartAfriHubs Digital Innovation Hub (https://www.smartafrihub.com/cs/home) was developed. Moreover, there was a community built around it, which is now active on WhatsUp and Facebook. During this year Hackathon was focused on improving functionality and making usage more user friendly .
METHODOLOGY
The methodology of the report contains the sections that describe the progress and results achieved for the entire challenge.
Team description
This challenge has been led by 2 mentors: Akaninyene Obot, a Nigerian lecturer of the Nnamdi Azikiwe University, who was mainly responsible for the specific use case of Forgotten Food. And then Markéta Kollerová, responsible mainly for smooth communication within the team and participants.
A very important person for this challenge has been also František Zadražil, the main developer of the technology and Hub4Everybody/SmartAfriHub portal, without whose support we could hardly achieve anything.
In our team, besides the core team around the P4A organization, there were 6 registered participants from Zambia, Burundi, Finland, Kenya and Uganda.
Description of the process of solution
The activities were divided into following parts:
- Technology development (see part of Technical Infrastructure)
- Training
- Stakeholders Need analysis
- Generating training and awareness content
Technical infrastructure
SmartAfriHub is presented to the user as a single and complex solution and workflow for managing geo-data. But it is built upon multiple separate components. The basic architecture of the whole system is depicted in the schema (Figure 1).
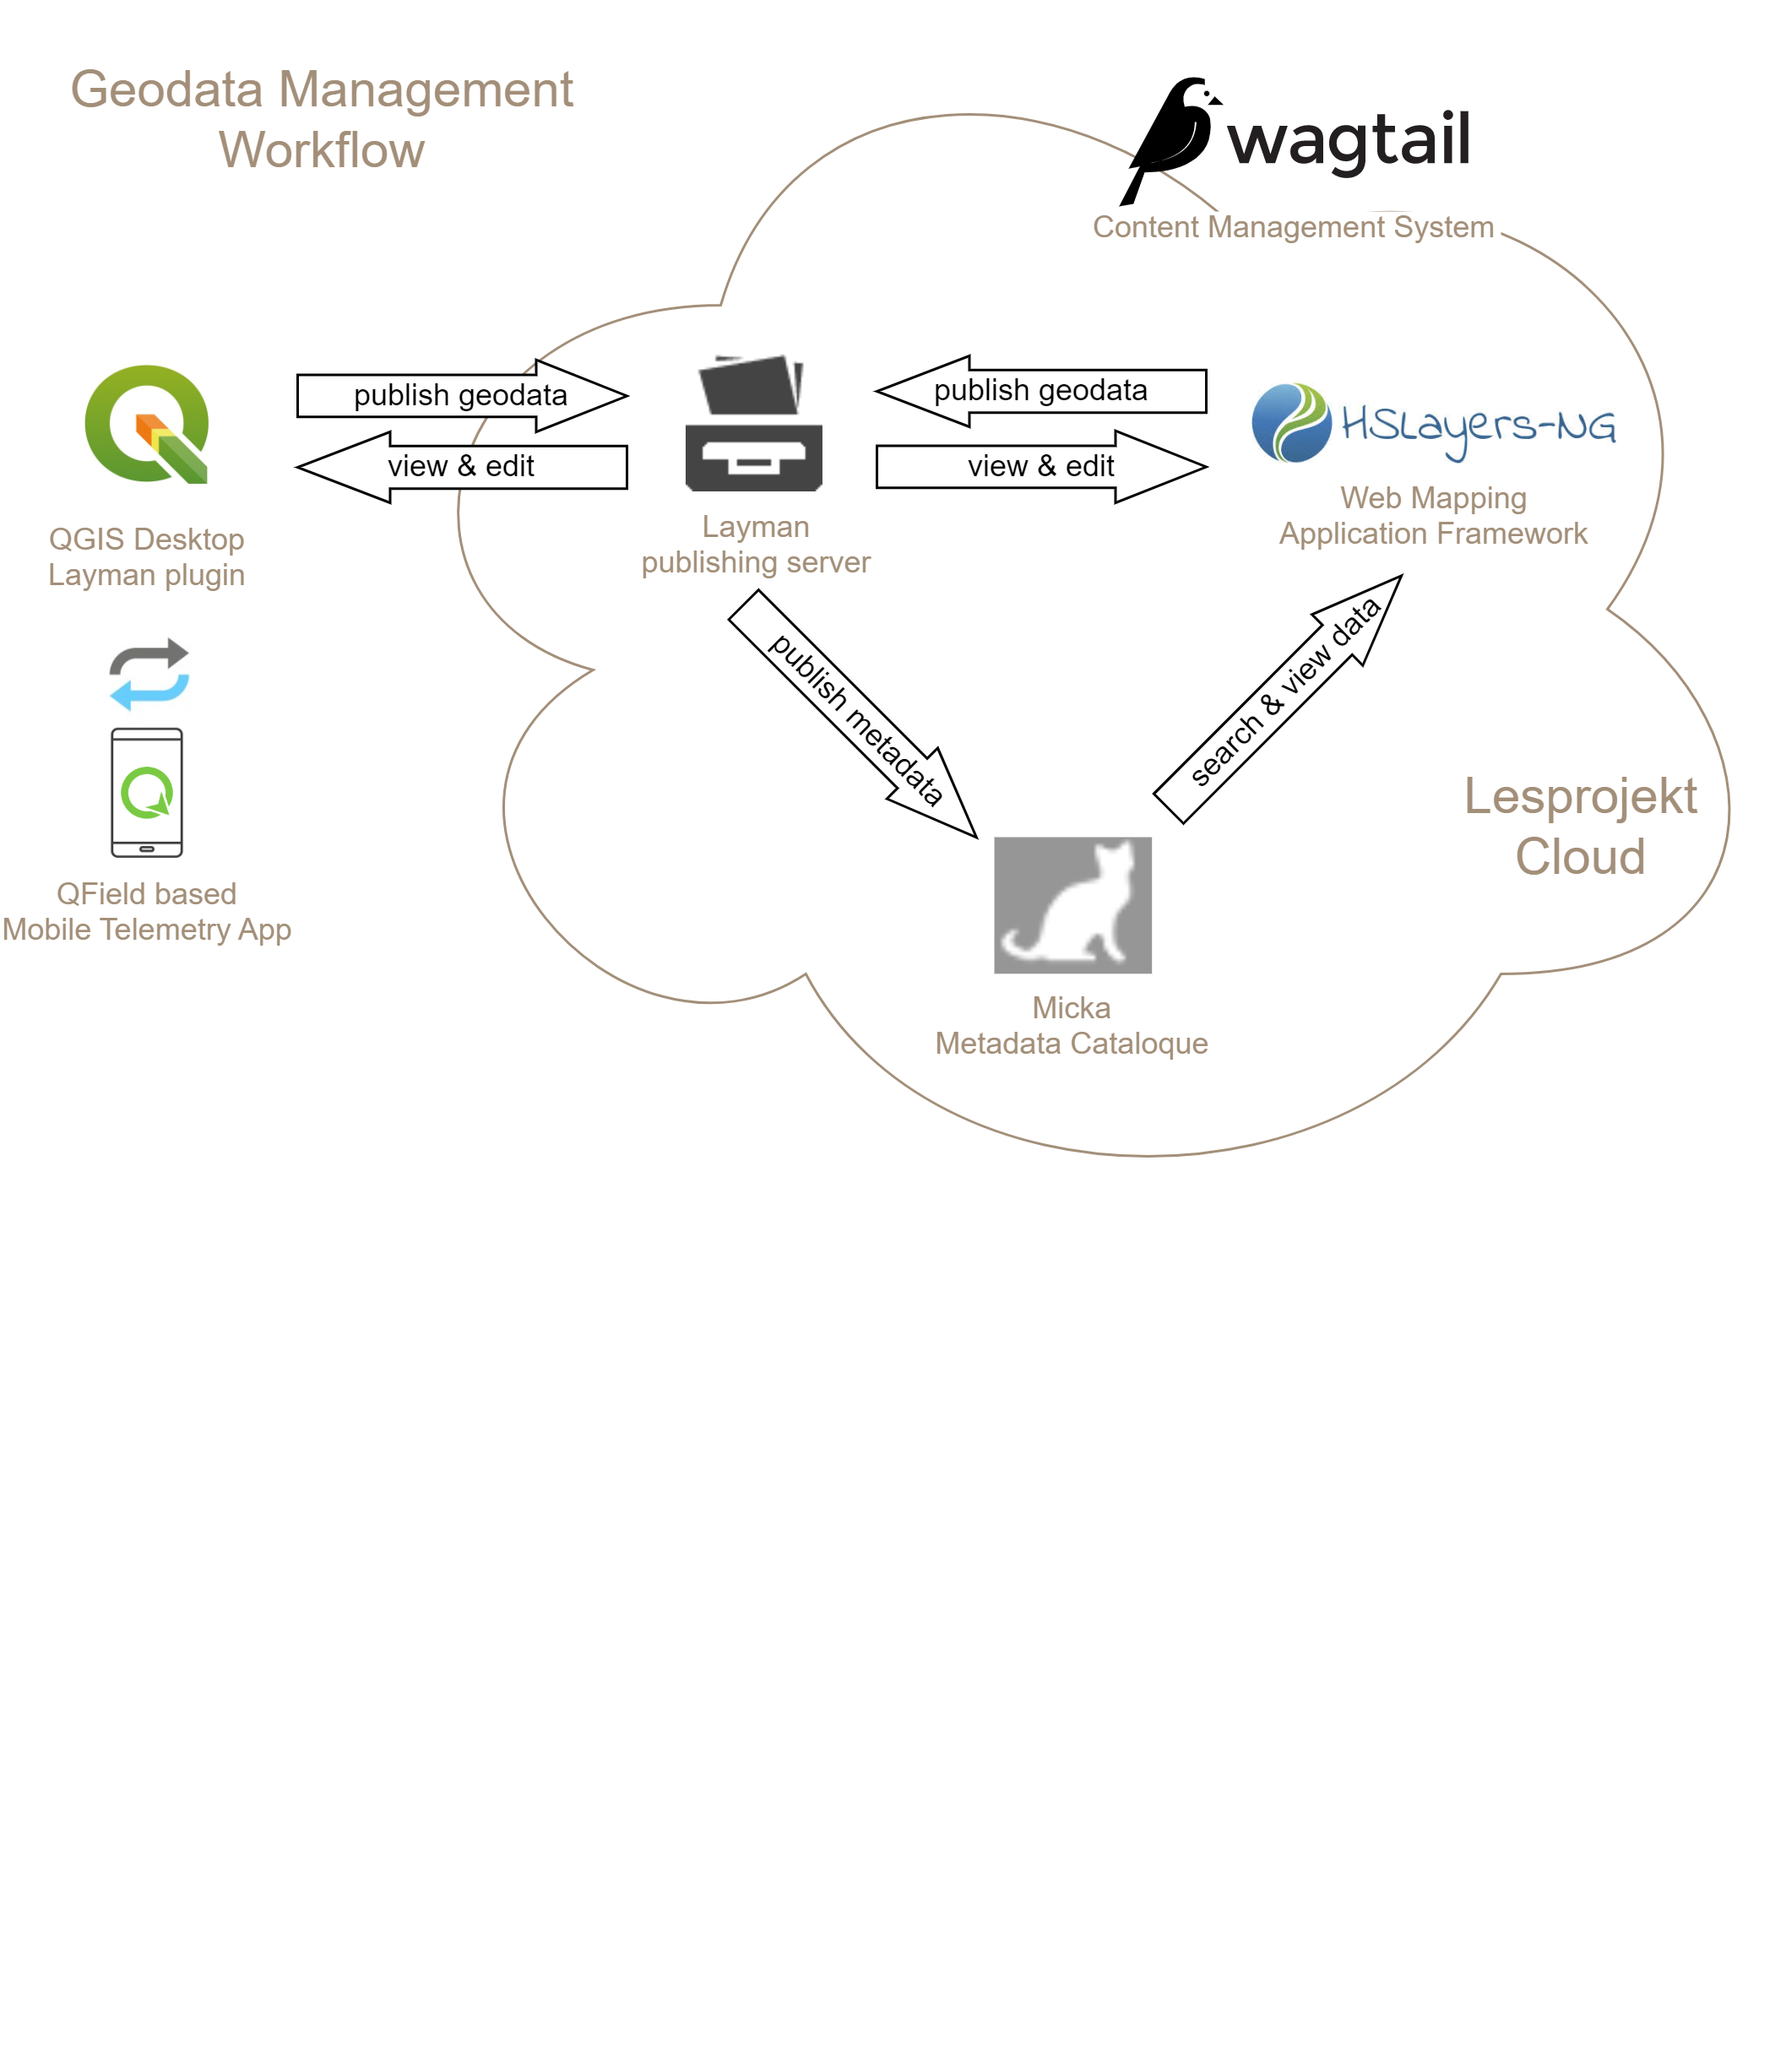
Figure 1. SmartAfriHub general architecture.
Content Management System (CMS)
The Editorial system represents a basic unifying element for geodata processing. This component allows for the creation of web portal content and also represents a natural junction for other parts of the system. Hub4Everybody uses Wagtail CMS (https://wagtail.org) Platform, extended by CodeRed CMS (https://www.coderedcorp.com/cms/). It is one of the leading open-source CMS used by small as well as large organizations (Google, NASA, British NHS). Wagtail is based on the Django system and the main programming language is Python. It enables very easy extension of the functionalities in the forms of widgets, web page templates, or extending of authorization and other system parameters. It is, therefore, possible to integrate it with other systems used within the organization (e.g. geoportal of a city), if such demand occurs. There is a huge community of developers behind the system, where more complements and extensions can be developed.
The default set of features has been extended to offer a larger set of web page elements including an interactive map application, see figure 2.
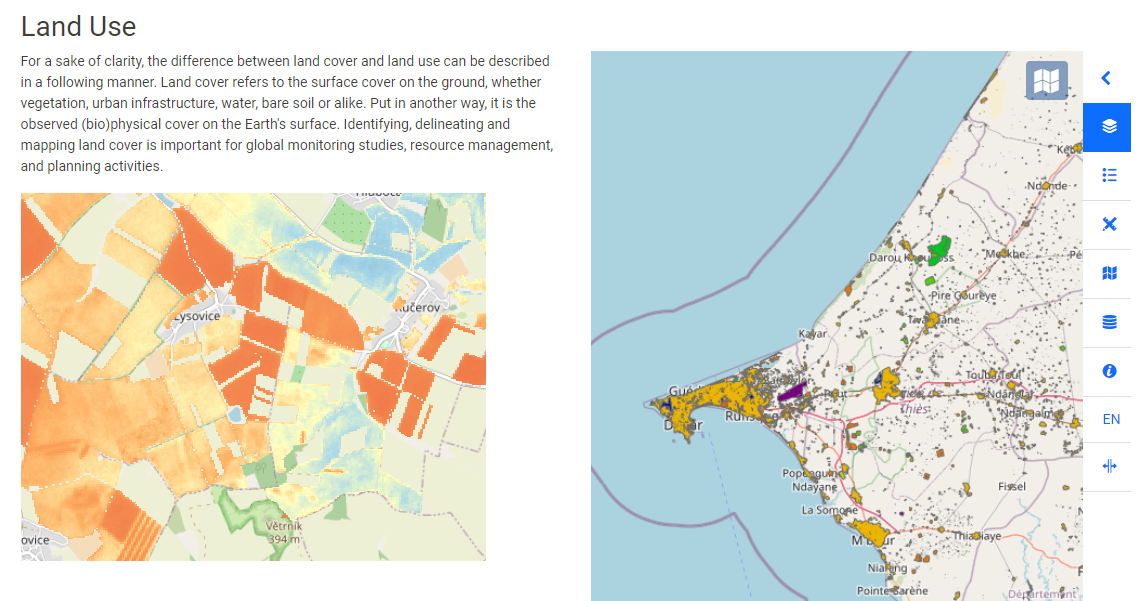
Figure 2. Example of a web page created by SmartAfriHub CMS including a map.
A web portal built by the content management presents the gateway for the user and unifies the rest of the system on the level of user identity. That means the user has one account to access all the components no matter if it is on a web platform or desktop application. Single Sign-On is ensured this way.
Web Map Application
The web mapping component (figure 3) uses the open-source mapping framework HSLayers-NG, see https://ng.hslayers.org/. This tool is built upon the basis of OpenLayers and enables significant customization and functional additions depending on the requirements of the system. At the same time, there is a functionaintegration to the Wagtail CMS in the form of a map widget, which allows easy creation of maps within all HTML pages of the content management system, including the detailed configuration of map layers and tools if required.
Important role of the web map is to publish geo-data in the form of single layers or complex thematic maps. Most common vector and raster data formats are supported (GeoJSON, Esri Shapefile, KML, GPX, GeoTiff, JPEG, PNG).
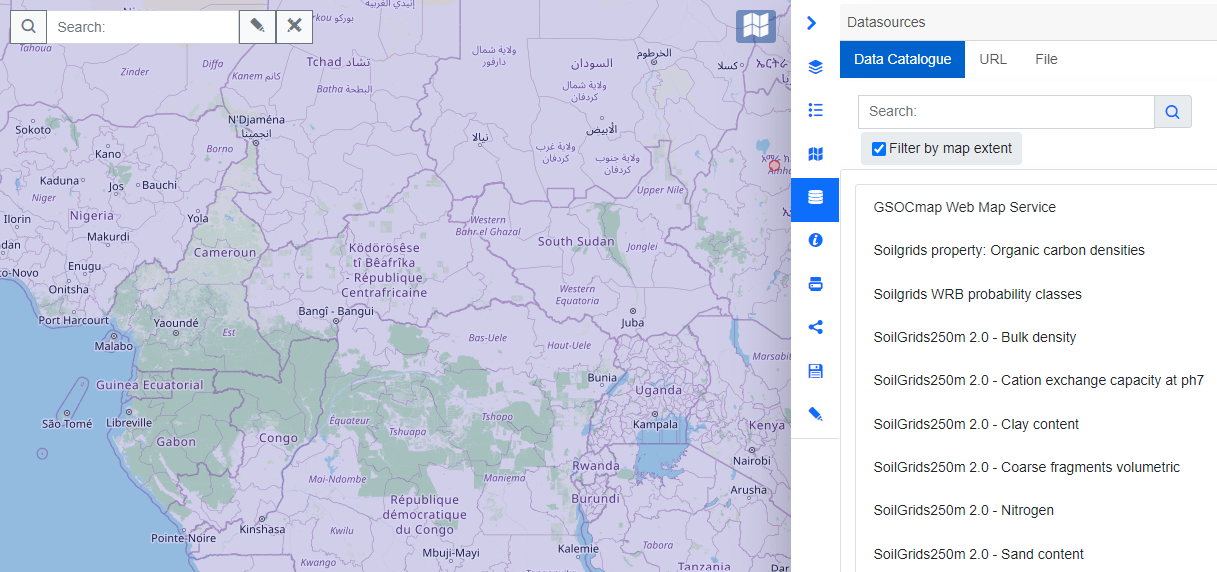
Figure 3. Web mapping component.
Desktop GIS Client
All the geo-data publishing tasks that can be carried out in the web application are available also via a desktop client. That is represented by a plugin for the most popular open-source GIS platform QGIS. The plugin is called “Layman” and is available through the native QGIS repository. Similar to the HSLayers web map, spatial data layers can be published as services and thematic maps composed of layers can be created using the Layman plugin.
Data Publishing Server
Both HSLayers and QGIS Layman plugin act as client applications which means they don’t do the actual data publishing but are using some other service for that. And that is the role of Layman (https://github.com/LayerManager/layman), the publishing server that automatically converts geo-data into web services in OGC WMS and WFS standards. It provides an extensive REST API so any other possible client can be connected.
Metadata Catalogue
Any geo-data management system cannot work without metadata. Micka is the detailed metadata catalogue with INSPIRE standard support. All geodata published by our tools is automatically metadata-recorded. The metadata can be searched back through the HSLayers web client or the QGIS desktop tool.
Mobile support
HSLayers web application naturally supports mobile devices and is convenient to use. But that is not enough in today’s mobile world. That is why the mobile apps based on QField (https://qfield.org/) have been recently adopted in our solution pipeline. It is an exaggeration to say that it is a mobile QGIS, which also allows you to view published maps on your mobile phone and offers tools for data collection in the field. And all this can be extended according to your requirements. The possibility to easily publish maps also to the QField Cloud (https://qfield.cloud/) is a work in progress and will be available soon.
Training
During the hackathon, we were able to organize a couple of overall meetings, 1 large webinar dedicated to Hub4Everybody technology, with an audience of registered 120 participants geographically covering countries throughout the whole Europe, then Africa, South America and also Asia.
Above that, we have organized two specific training sessions on using the SmartAfriHub portal, where Frantisek showed step-by-step how the new content can be created and uploaded on-line. Both training sessions were recorded and uploaded on the Youtube channel of Plan4all, as was the Hub4Everybody webinar.
Links:
Hub4Everybody
https://www.youtube.com/watch?v=_t5mtReGjN4
SmartAfriHub 1
https://www.youtube.com/watch?v=3oHpxXFsYeU
SmartAfriHub 2
https://www.youtube.com/watch?v=G1VFv6MKkEE
Analysis of needs of stakeholder groups
A discussion with stakeholders in Africa was led on what are the needs for attracting people to use the new Hub and also to contribute with new content. It was discussed that we need to show the possibilities to build informational content in attractive form. It is necessary to demonstrate interesting content possibilities of presentation of different problems. On the basis of discussion a FARA document: Africa Manifesto and Plan of Action[1] was selected as an example.
Experimental results
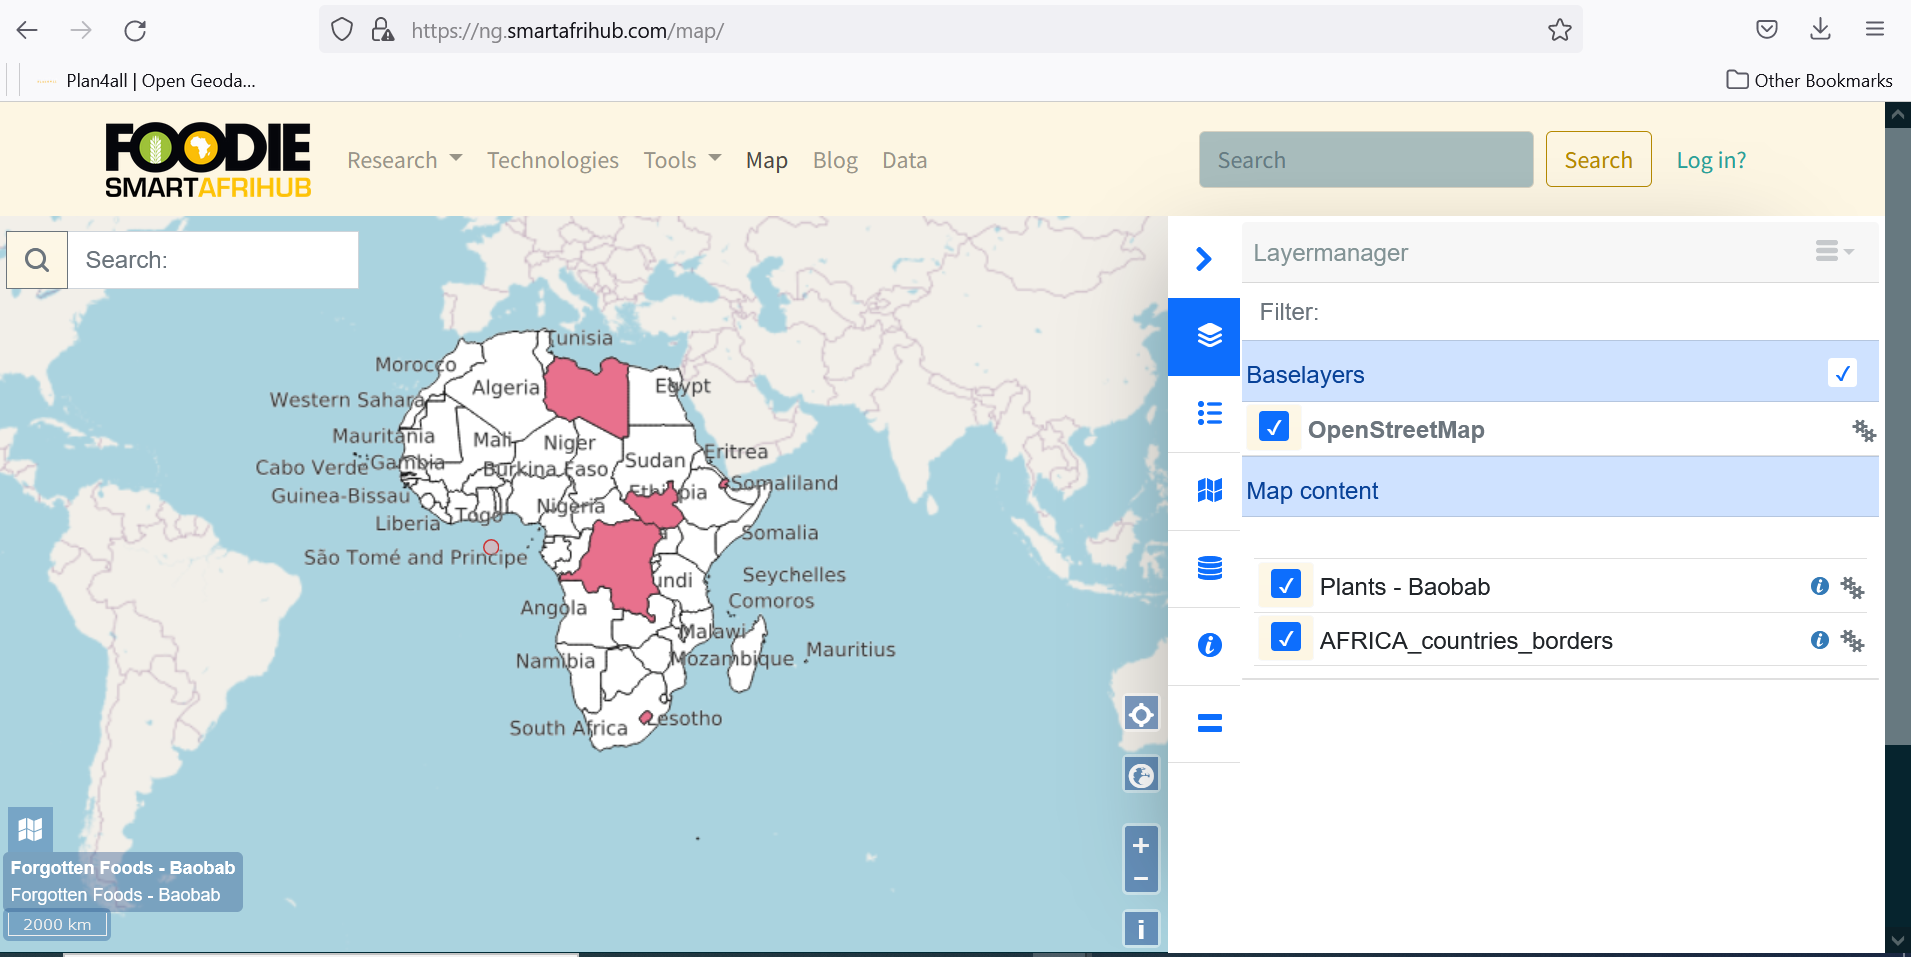
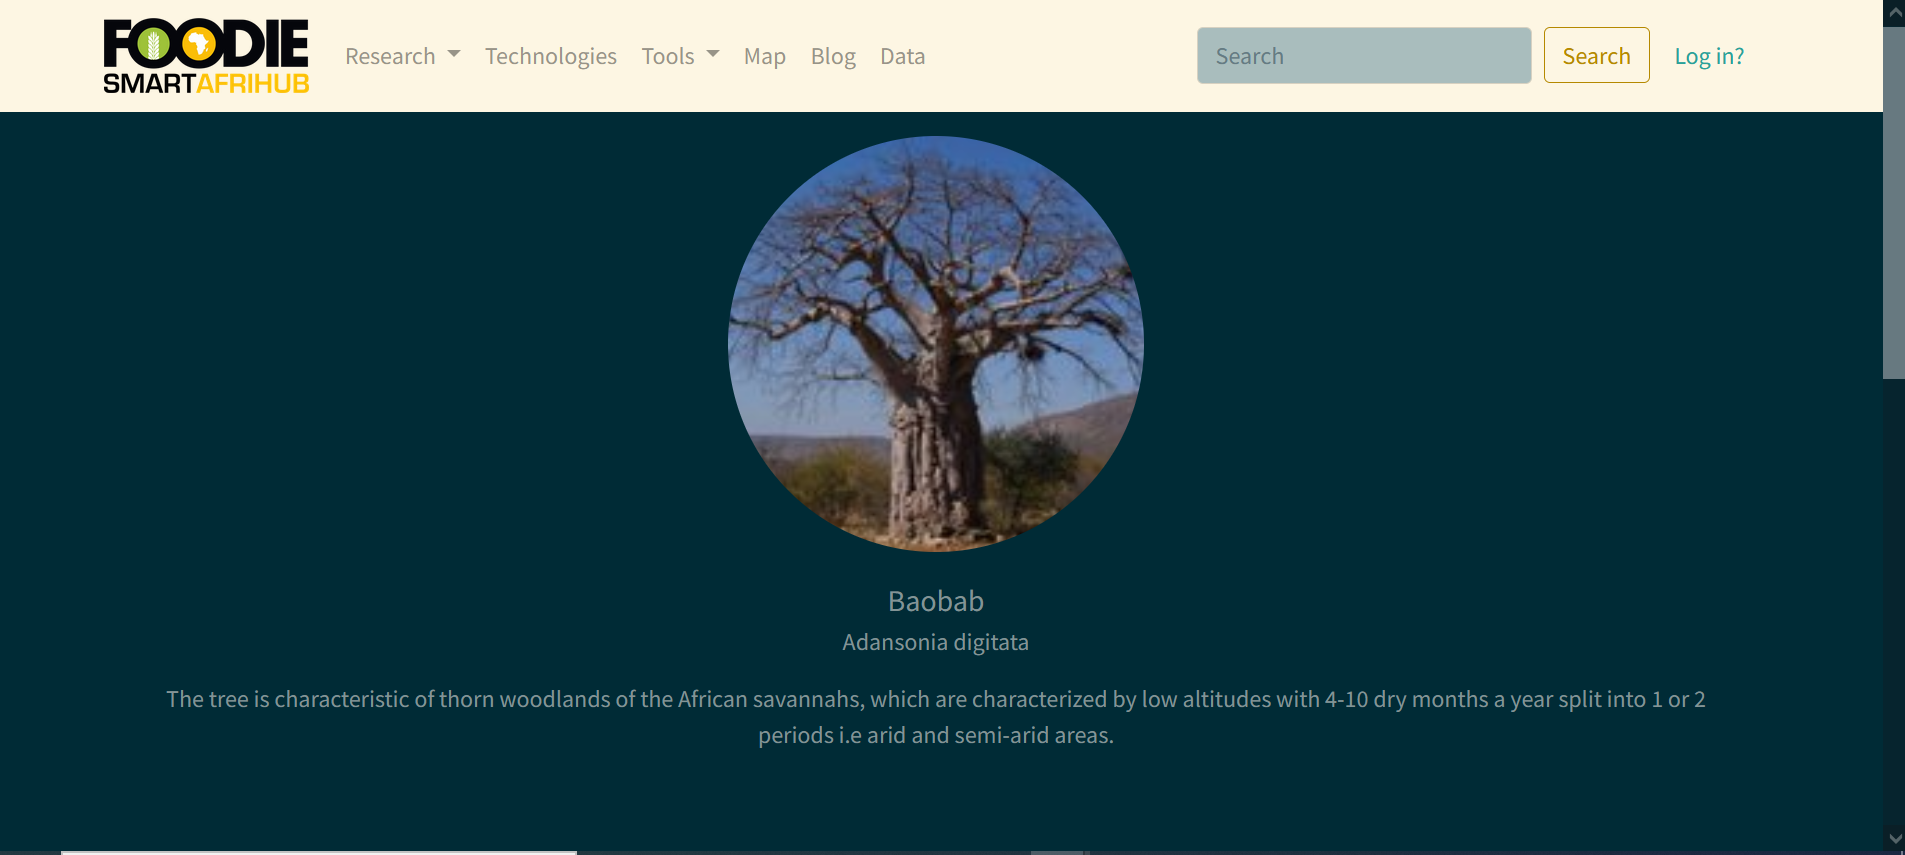
A demo presentation of two forgotten crops of Africa – Ocra and Baobab was prepared (later we plan to prepare a presentation of all crops).
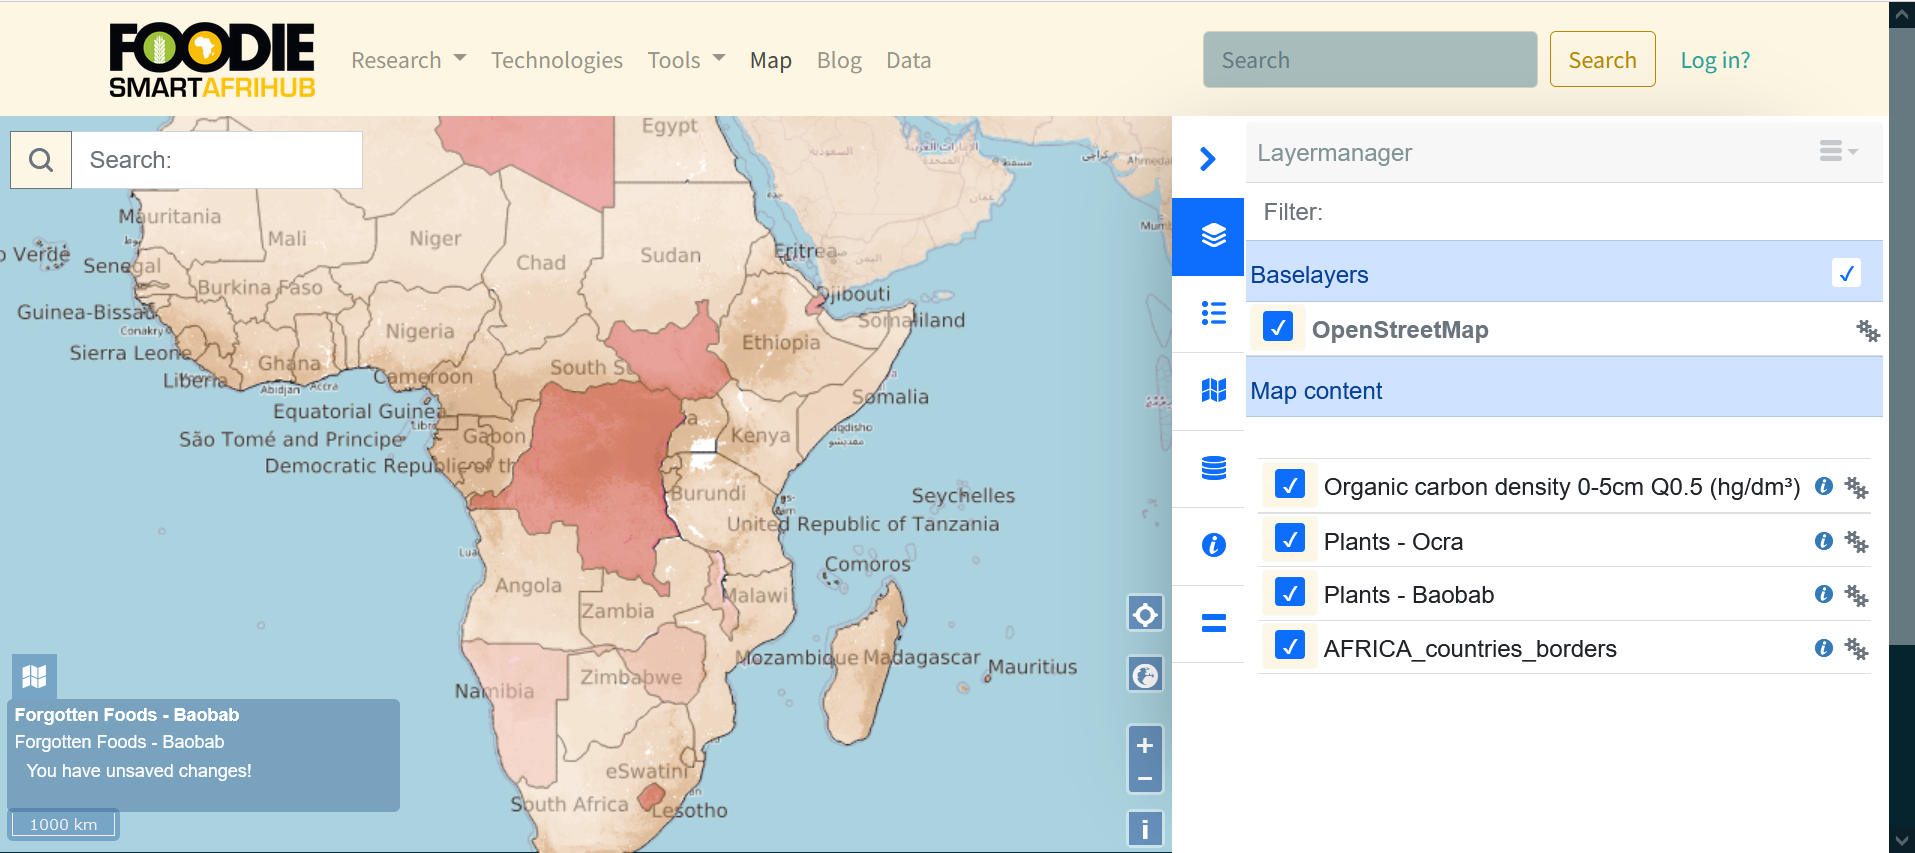
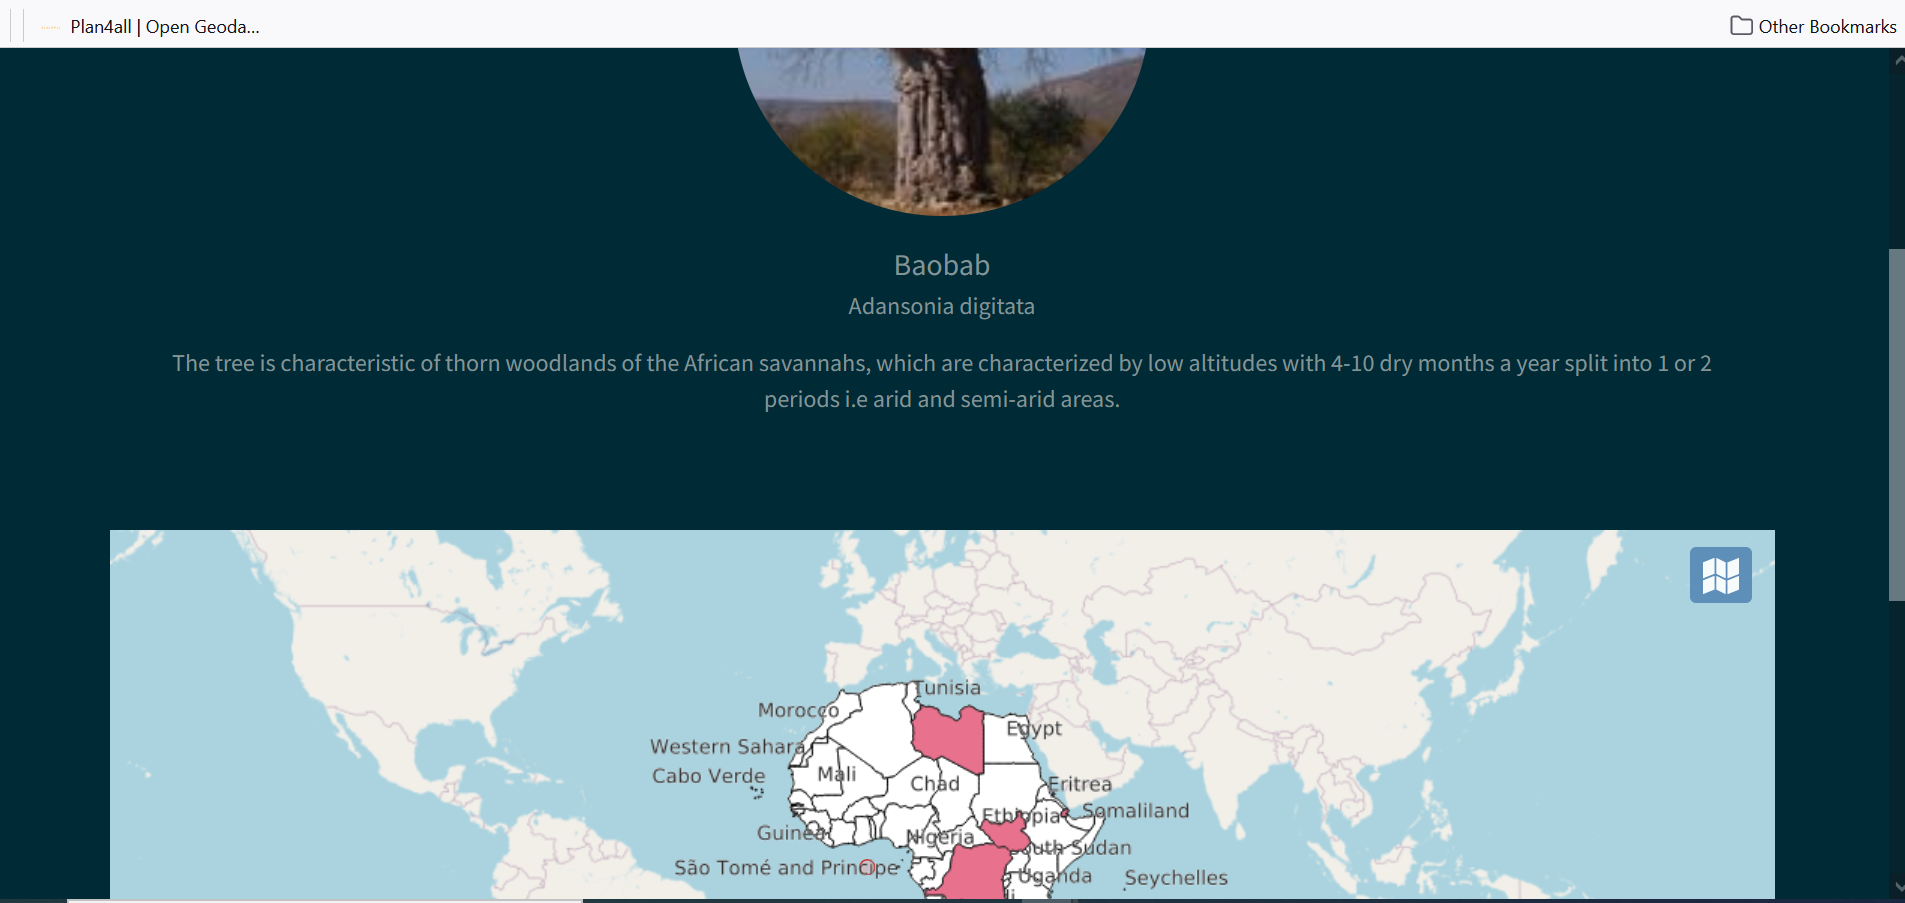
At the first stage, interactive maps of countries, in which these crops are growing, were prepared and published on the Hub.
Baobab:
Ocra:
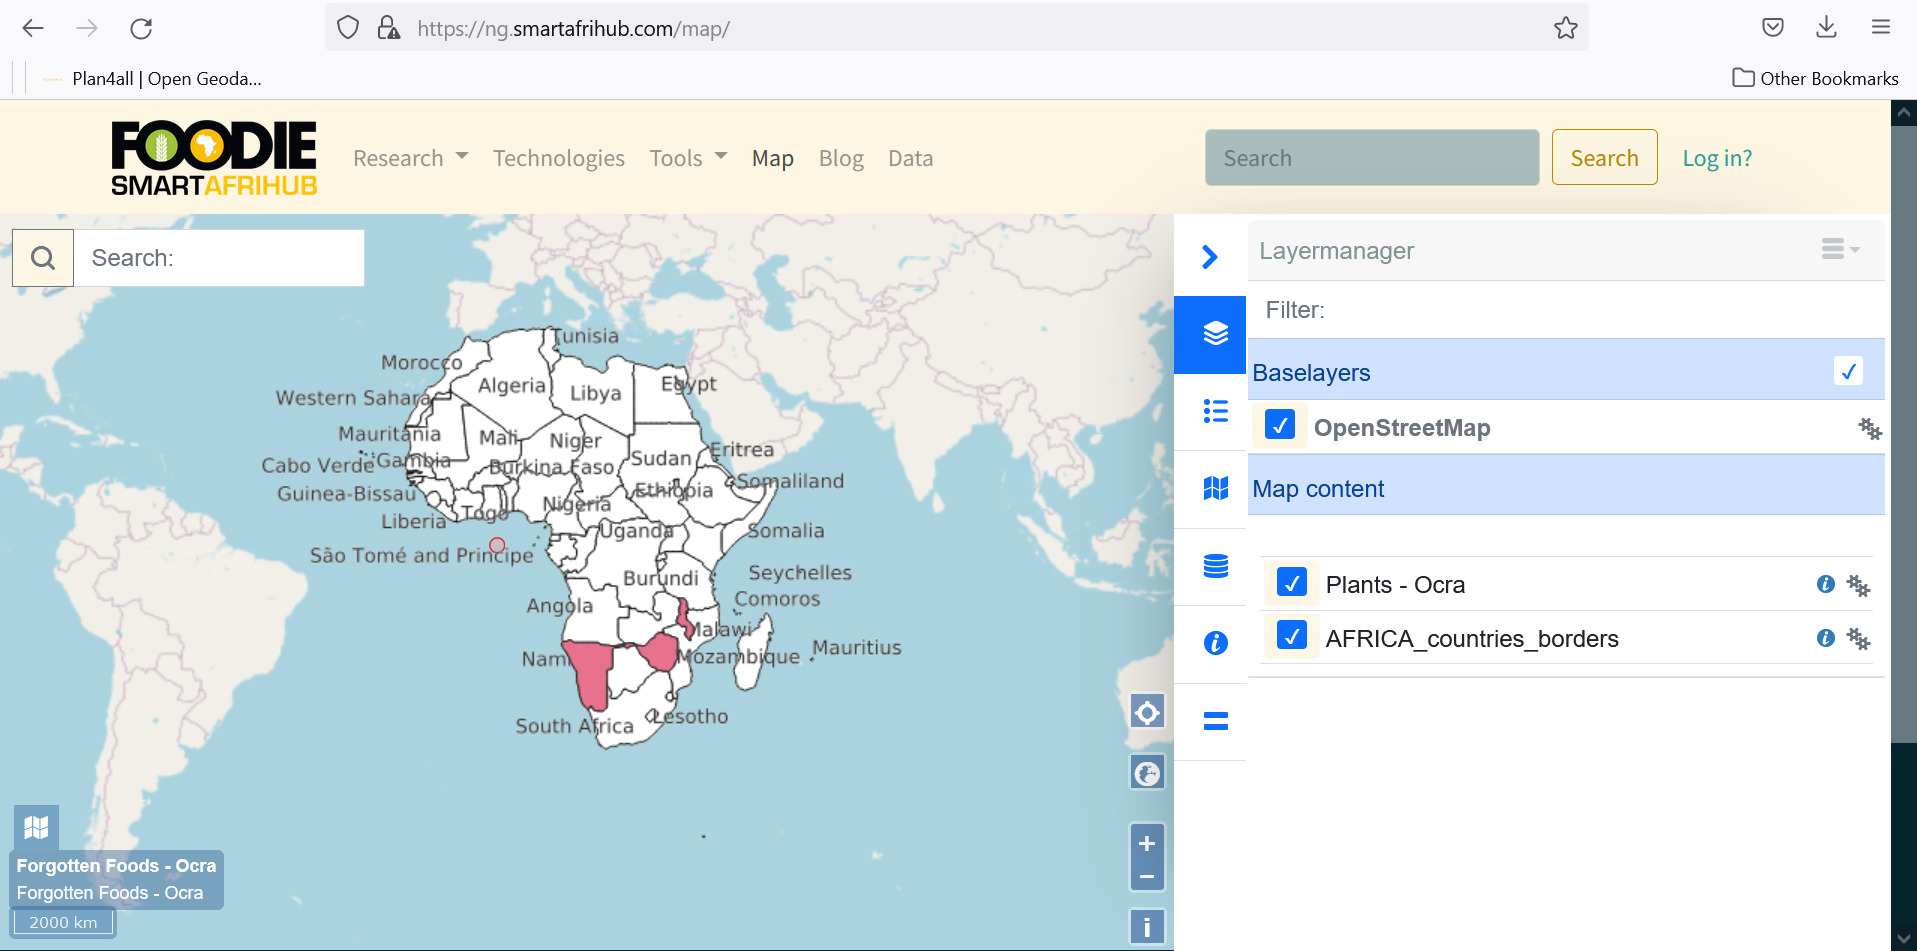
This will also give us possibilities in the future to combine this data with different data or analyze regions with different crops.
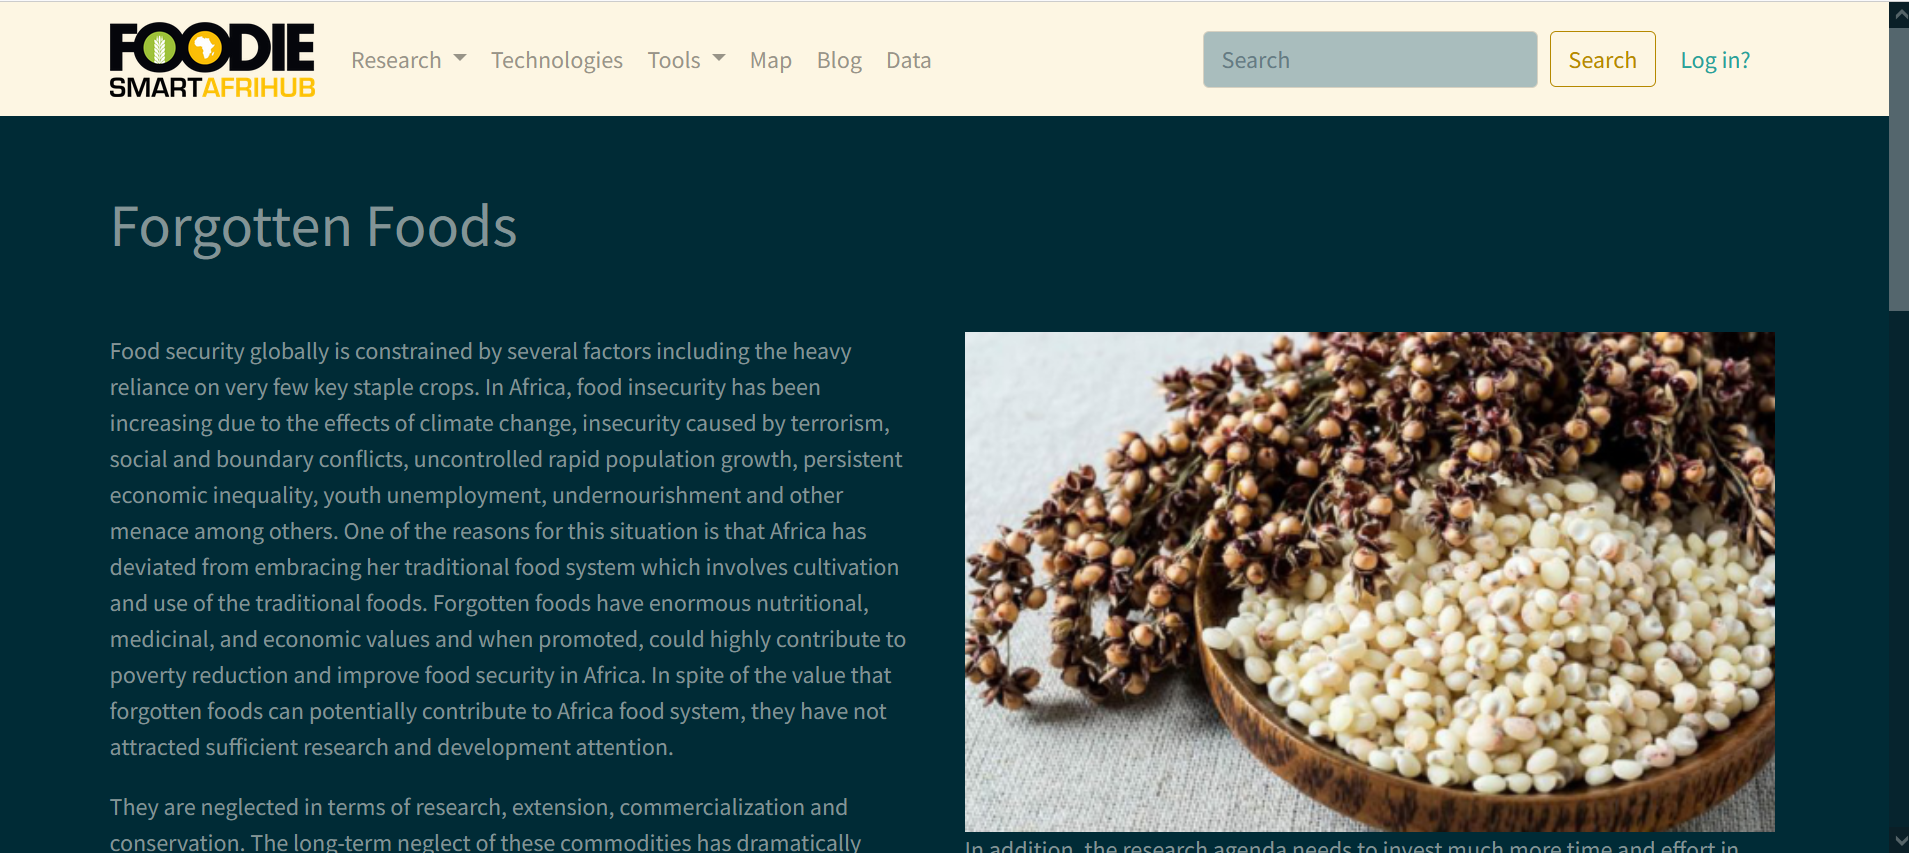
In the next step a basic web page related to Forgotten Food was prepared:
A web page for each selected crop was developed:
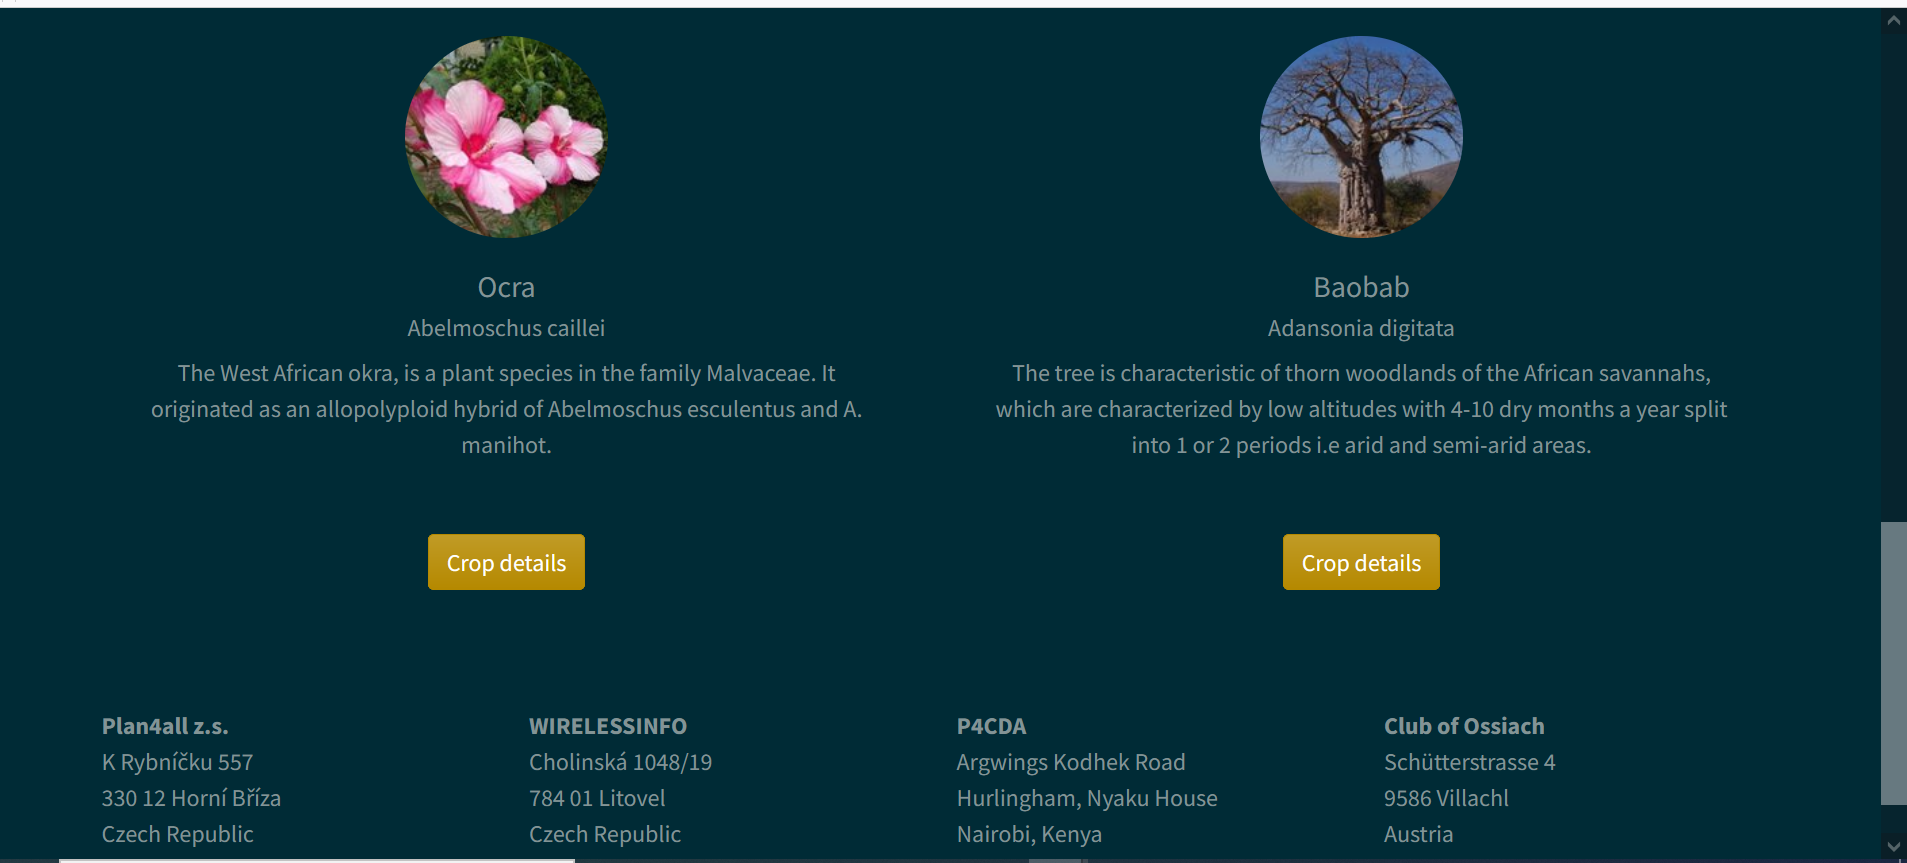
With a dynamic map:
This was demonstrated as proof of concept.
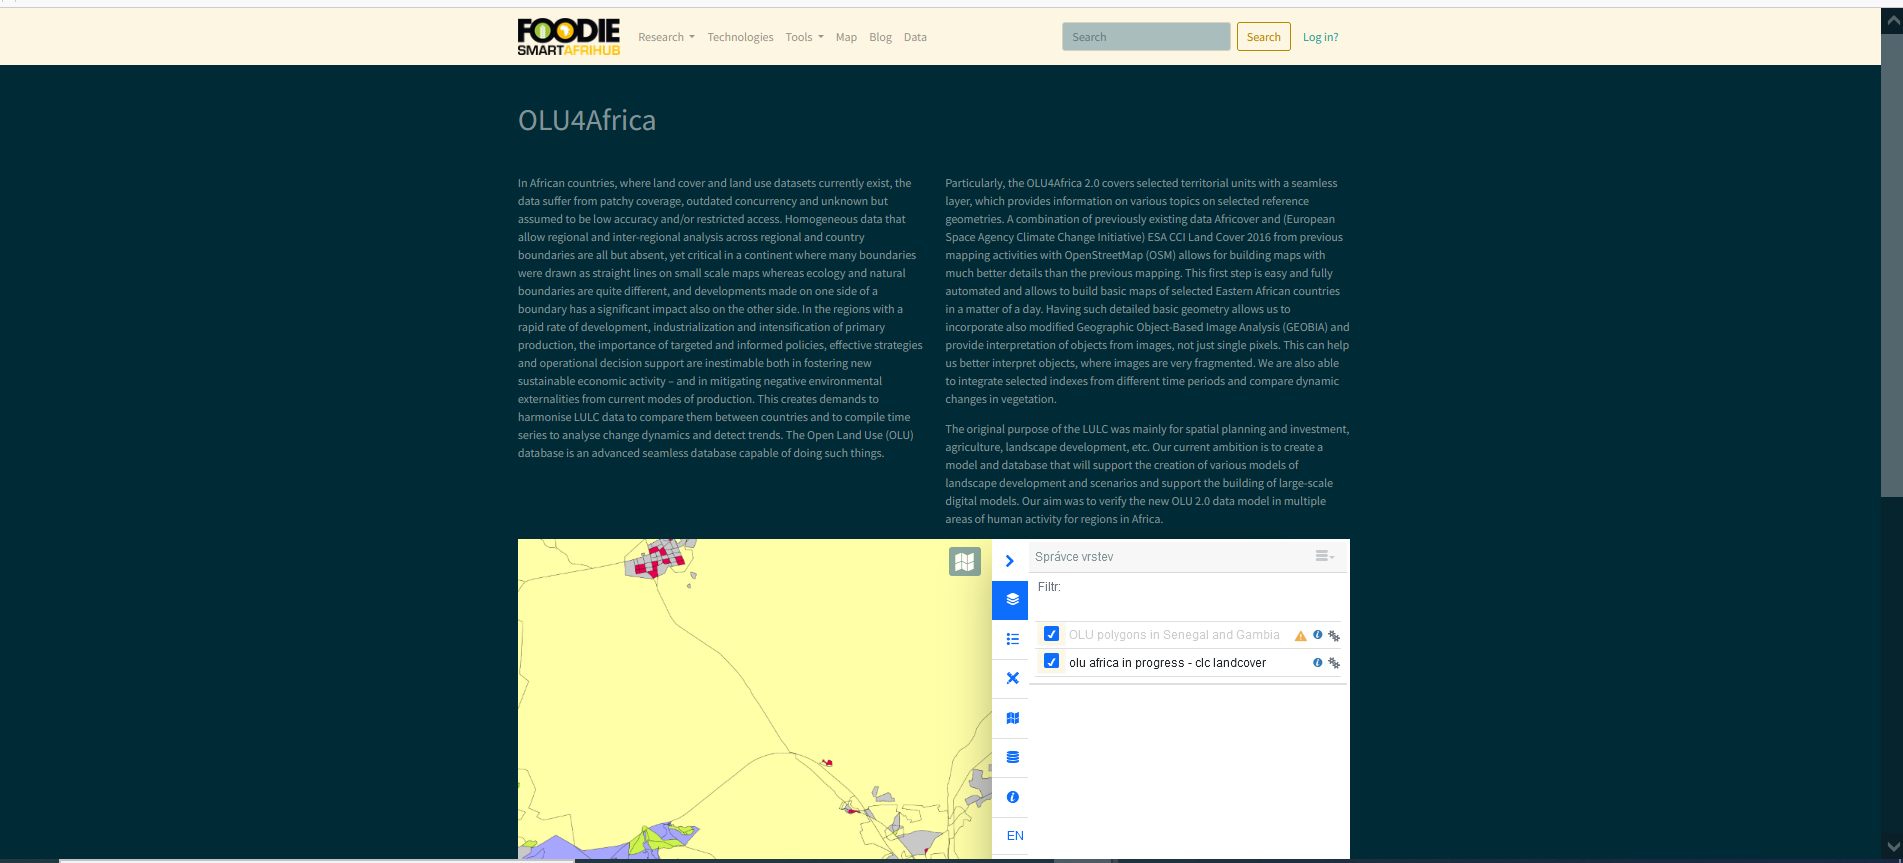
Presentation of OLU4Africa
The result of challenges #8: How to use and improve OLU 2.0, #7: OLU4Africa are now presented on Hub as other example in area of Research https://ng.smartafrihub.com/olu4africa/.
FINDINGS & CONCLUSION
Discussion of the results and findings
The solution based on Wegtail is more user friendly than the previous Liferay based solution.
To attract the larger community it is necessary to generate interesting content, which can be useful.
It is easy to integrate map content with educational and awareness content with the new Wegtail solution.
Further improvements
We will transfer data from the previous SmartAfriHub portal into the new technology portal. A feasibility test was already performed.
We plan to integrate the full OLU4Africa as one of the key data sets.
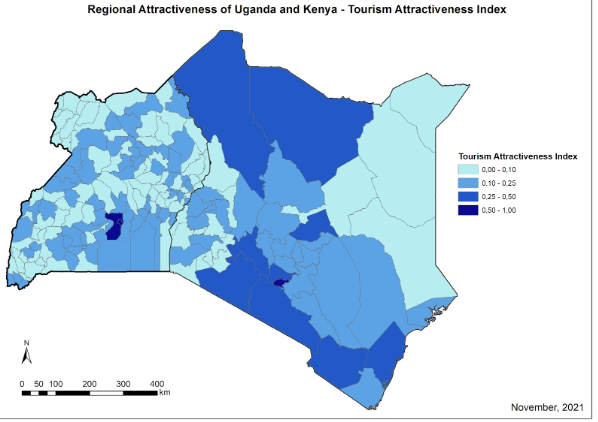
We will also transfer all Forgotten Food into this interactive presentation, and we plan to add new data as for example Rural Attractiveness to the SmartAfriHub.
We need to continue with regular training of the African communities and wider promotion of the SmartAfriHub.
We also need to look for additional resources for development and extension of this new solution.
[1] https://library.faraafrica.org/2022/03/21/africa-manifesto-and-plan-of-action-on-forgotten-foods/