
FINAL REPORT ON CHALLENGE #11: Automatization of calculation of management zones based on Yield potential
Name of mentors: Herman SNEVAJS, Jana SEIDLOVA
Participants: Vincent ONCKELET, Dmitrii KOZHUKH, Jan MACURA
INTRODUCTION
Rapidly rising input prices are forcing farmers to save on fertilisers and use them as efficiently as possible.
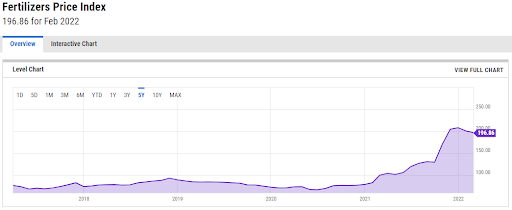
Fertilizers Price Index, 21st March 2022, source: https://ycharts.com/indicators/fertilizers_index_world_bank
The most sensible response to rising fertiliser prices is precision agriculture based on variable approach to field. Replacing a uniform rate for the whole field with a variable rate that takes account of the specific requirements of the site is of the greatest importance. Approximately 8% of fertilizers are saved when the Variable Rate Application approach is used (a case study). Most of the machinery used by farmers is capable of applying variable rate of fertilizers automatically based on a prescription application map.
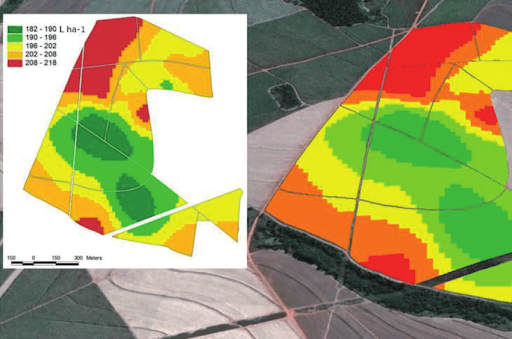
An example of an application map, source: Variable Rate Application of Herbicides for Weed Management in Pre-and Postemergence
Application maps can be created based on vegetation indices derived from satellite imagery. Yield potential is a layer of relative index values on a plot over the last eight years. This provides resilience against single-year extremes.
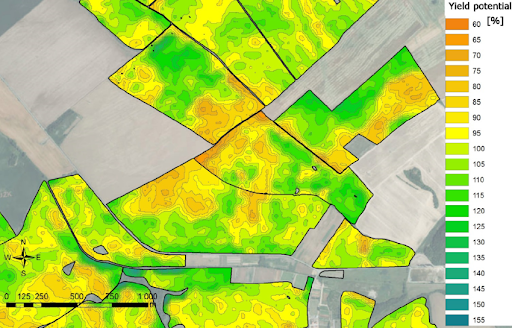
Relative yield potential, source: QUO VADIS PRECISION FARMING
The missing link in the chain is the rapid process of creating management zones from the yield potential layer. The farmer then simply assigns a fertiliser rate to each zone and an application map is created.
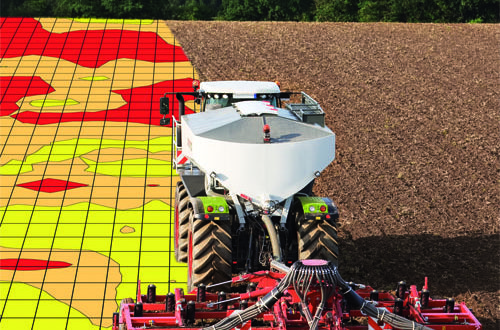
Variable Rate Aplication based on application map, source: https://www.farmmanagement.pro/the-return-of-variable-rate/
We work with several farms, which allows us to compare research results with the real situation and apply them in practice.
The goal of this challenge is to automate the process of creating management zones from the yield potential layer, which would make variable fertilizer application significantly more affordable due to its accuracy and speed of creation.
RESULTS
Overview
Based on user requirements and practical application of the application, we have slightly redefined the objective of the challenge. Instead of automatically calculating management zones from yield potential, we focused on a tool to automatically calculate zones from any vegetation index layer. Most of the steps required to create this tool are the same. The inputs to the tool are two:
1, The vegetation index layer and 2, The boundary of the field(s) the user wants to divide into zones.
Index research
The input data is relatively easy to access. The process for downloading the satellite data and automatically calculating the vegetation index has been created and well proven some time ago. Basically, it can be any layer that shows the variability in the field. If the input layer is a moisture index, the output zones will represent moisture zones. A typical input is the NDVI or EVI layer for which the instrument has been tested. The main limitation of these layers is the unavailability during cloudy days. Therefore, we also work with radar satellite data, which does not have this limitation and is regularly available several times a week. The radar vegetation sensor RVI4S1 can also be used as input for zone calculations. The challenge included testing various indices and presenting them to the public. For this purpose we used the Hub4Everybody portal: https://hub4everybody.lesprojekt.cz/vegetation-indices/. The creation of this portal was the task of Challenge #9 A new social space for geographic information sharing and education. Further enrichment of this site is planned.
Field boundaries
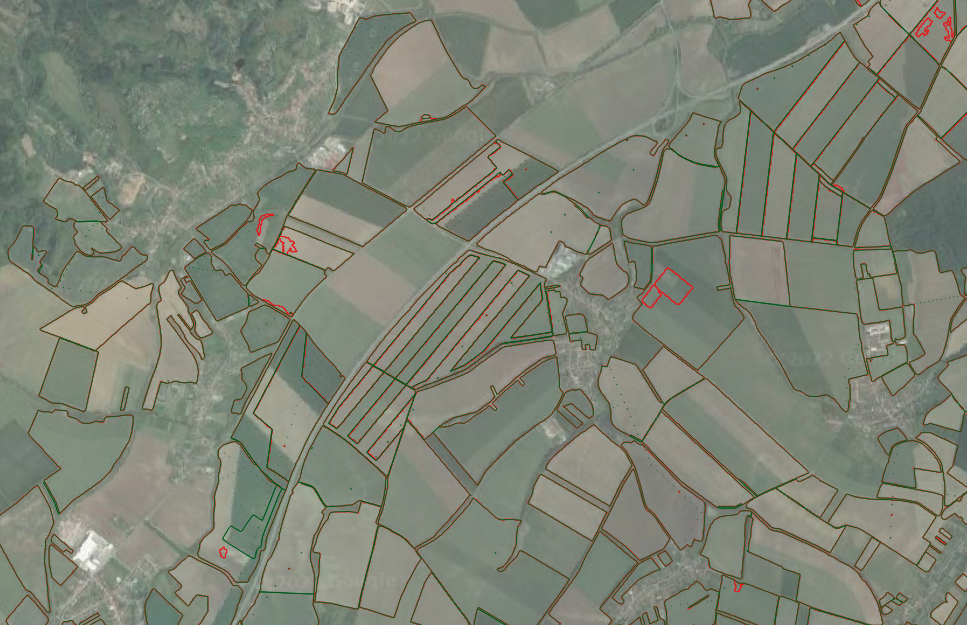
The second crucial input is the property boundaries. Many farms keep their own land records that contain information on the boundaries of each crop. If this data does not exist, it is possible to use LPIS data, which records all agricultural land and is freely available in the Czech Republic. However, sometimes there are multiple crops in an LPIS land block, which could lead to misinterpretation. It is possible to obtain this data by advanced analysis of satellite data using unsupervised classification. Work on this instrument has begun and promising experiments have been carried out. Nevertheless, the service is not fully automated and is under development.
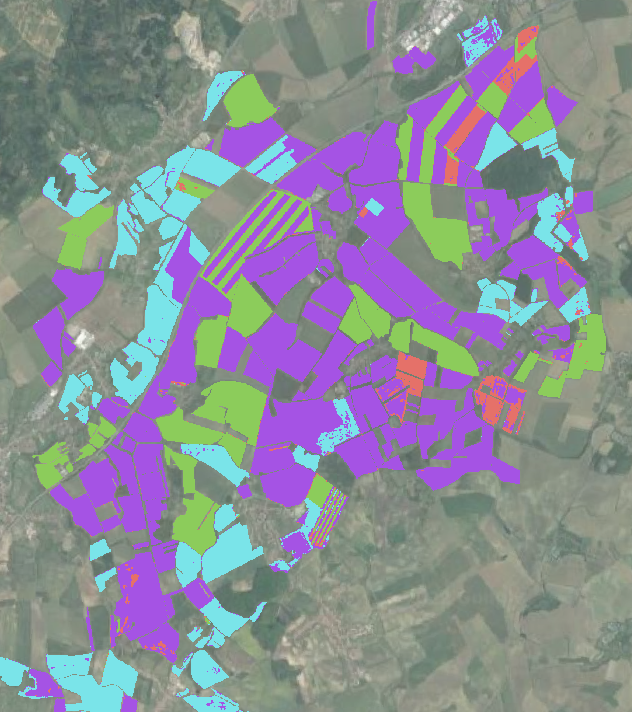
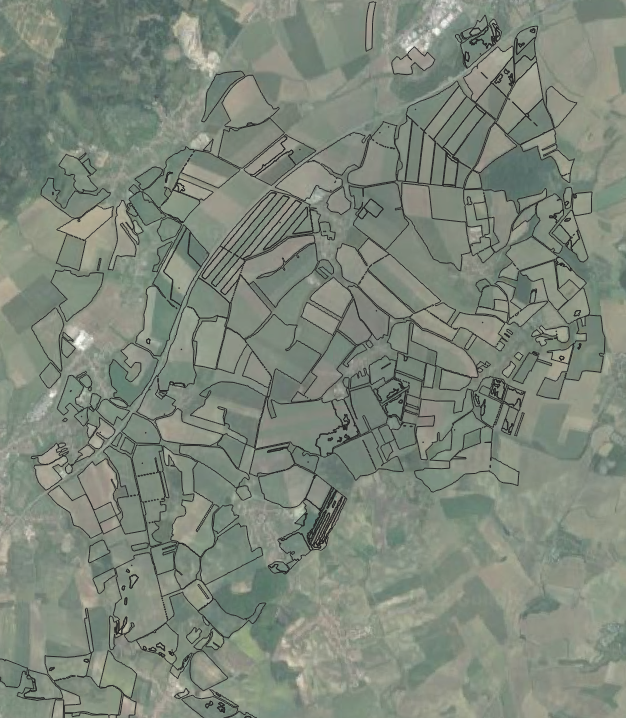
Extraction of field boundaries using unsupervised classification of the satellite data
FieldCalc tool
Tool that creates zones from a satellite image was the most expected outcome of the challenge. The tool was theoretically designed, it was also published for test purposes and implemented in FarmInsight – an app for farmers. See Agrihub INSPIRE Hackathon 2022 Challenge #1: Further development and testing of the application for creating application maps.
Technical information about FieldCalc
There have been two endpoints in flask created:
- Get dates (searches available dates by product type (EVI/RVI4S1) and field centroid point)
product: EVI
centroid: {“type”:”Point”,”coordinates”:[16.980843260843923,49.23431520358704]}
- Get zones (get management zones by geojson of field/s, date of imagery, product type, gaussian blur size, number of management zones, output format and weather extract zones by contour lines)
smooth: 5
date: “2020-05-20T10:00:29”
format: “geojson”
geojson: {type: “FeatureCollection”, name: “Selected field”,…}
number_of_quantiles: 3
product: “EVI”
contours: True (new option since this week)
There has also been a prototype application created that demonstrates use of this API. It runs at: https://fieldcalc.lesprojekt.cz/ and demonstrates basic logic of how to use the API.
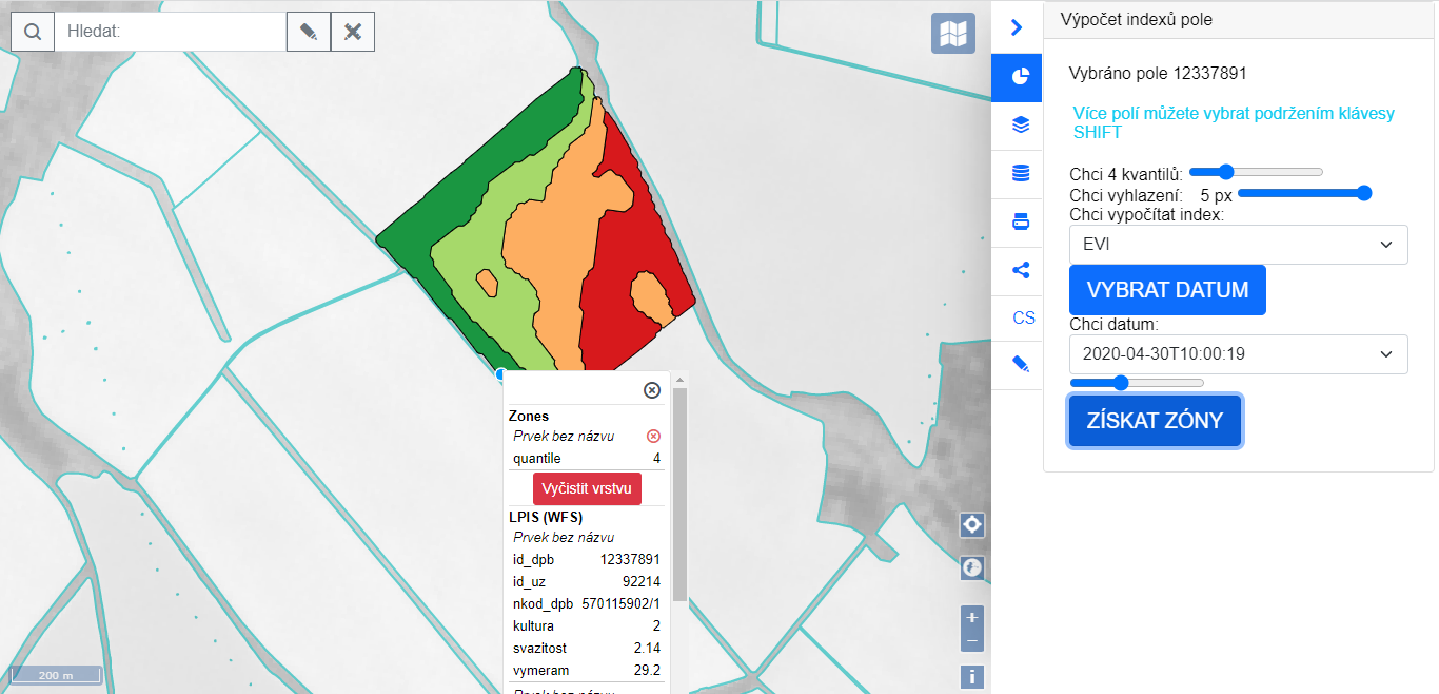
There is a reference layer with LPIS fields loaded into the application initially (one WMS layer for smaller scale to get oriented, and another one WFS layer, that is loaded at a bigger scale for actual field selection). The user selects his field/s from the map and then has the opportunity to select product type (EVI/RVI4S1). This sends the request get_dates to the server and the server responds with available index dates. The available dates are then displayed as a list. User then picks up the date he is interested in from the list and fills in other inputs (number of quantiles, gaussian smooth size to apply). After that the request is sent to the server, processed and the resulting management zones are sent back in geojson format.
Newly there is an option to select an algorithm that will compute the management zones but it is not yet implemented in the app. There are two algorithms available. Initial one proceeds like:
- Select imagery for the selected date for the given location
- Crop imagery by the field borders (plus necessary buffer to account for gaussian filter in the next step)
- Apply Gaussian filter to smooth image with sigma parameter
- Divide values of pixels into x quantiles
- Vectorize zones into requested format and send to user
And the new one following:
- Select imagery for the selected date for the given location
- Crop imagery by the field borders (plus necessary buffer to account for gaussian filter in the next step)
- Apply Gaussian filter to smooth image with sigma parameter
- Compute limit values for x quantiles
- Set constant value outside fields boundary that is slightly smaller than the minimal limit value (this is done in order to have all contour lines closed)
- Generate contour lines through these limit values
- Polygonize contours into requested format and send to user
Since the distribution of indices is continous, the second method (countour based) is more appropriate, gives smoother lines and is faster. So for management zones computed based on continuous variables this algorithm is adviced.
The technologies that were used are:
- Python (ogr, gdal, numpy, skimage…) for computation
- Python (flask) for running endpoints (services)
- HSLayers – map application functionality
- Mapserver – publication of WMS/WFS services
List of the result
| FieldCalc tool | prototype application at https://fieldcalc.lesprojekt.cz/ |
| Information about indices | summary at https://hub4everybody.lesprojekt.cz/vegetation-indices/ |
| Field borders detection | Verifying of unsupervised classification |
Team & cooperation:
Vincent OCKLELET, Dmitrij KOZHUCH, Jan MACURA, Jana SEIDLOVA, Herman SNEVAJS.
As mentioned in the text, results of our challenge have been used in challenges #1 and #9 of Agrihub INSPIRE Hackathon 2022.
CONCLUSION
Summary
We consider our main output, FieldCalc, a very practical and useful tool which offers new options to the farmers considering crop monitoring and interventions. A farmer can create his own zones based on an image one day old and use it on that day. (It can even be their own image coming from aerial mapping or UAV, too.)
Combination of these current zones with the long-term yield potential also opens new possibilities to understand the crop state and needs. When the current zone is low and the long term zone is high, it means more fertilizer will help the crop to reach the high potential. If the long term yield potential is low too, the farmer does not have to put in a lot of fertilizer because it won’t lead to high yields.
Further improvements
There are several improvements we want to work on.
- The user should see how the chosen image looks in true colors. The RGB image can be loaded as a background image when zones are calculated.
- Although enormous progress has been achieved, small details can be improved in the FieldCalc tool. Eg. there are sometimes unwanted little polygons in the zone map.
- Other zoning algorithms could be tested to compare the results.
- More advanced mathematics in the algorithm could take note of the variance of the index values. It could recommend a sensible number of output zones. Now the field is divided into the chosen number of zones even if it is a homogeneous field.