TEAM LEADER: Jiri Bouchal (InnoConnect)
TEAM MEMBERS: Jan Ježek (InnoConnect), Alvaro Silva (InnoConnect), Václav Kučera (SITMP)
PROJECT IDEA:
Problem we solve
There is a lot of big data available in the connected cities of today. Often, this data is stored for restrained purposes without any deeper analysis and visualisation. Users thus do not benefit from the data and from its understanding that would allow them to act based on the information obtained from data. Cities usually do not know how to work with their data further to get the knowledge out of it that could support the decision making.
Solution
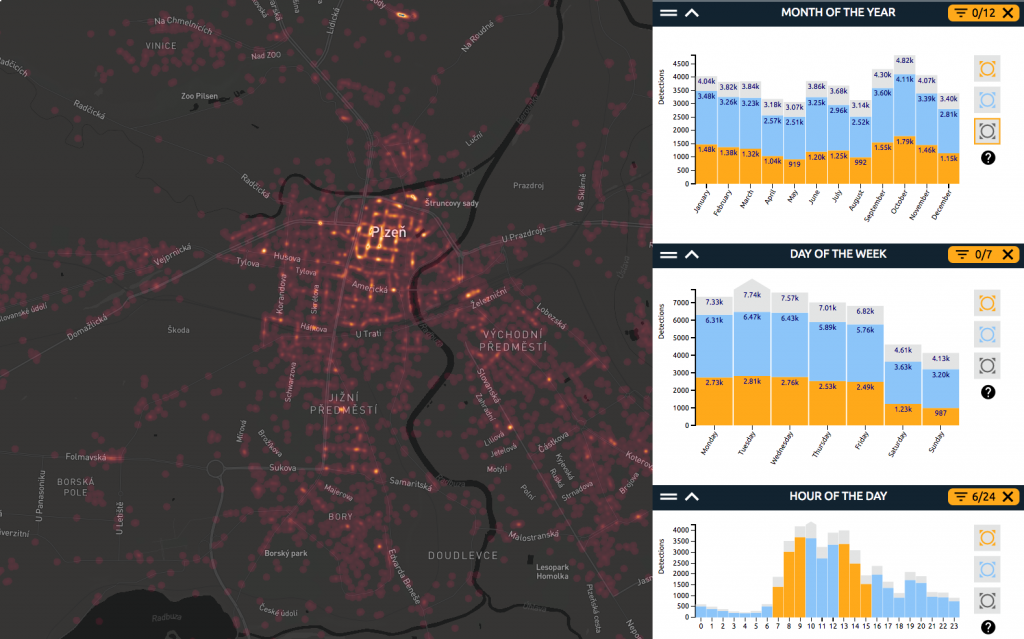
The proposed application will help the city of Plzeň (Czechia) to identify trends and patterns in their security-related data provided by the Municipal Police, e.g. to identify areas with the highest risk of minor criminality, streets with most frequent parking, driving or speed violations, locations with pedestrian or cyclist offences, or neighbourhoods with alcohol- and drug-related offences. The web application will bring the data into a map and make it possible to analyze it for trends and patterns.
It will allow interactive analysis of large spatial data, using WebGLayer heatmap technology.
Thanks to the solution, users will benefit from visual insights obtained from the data. They can drill into the data, look at different combinations of attributes (such as specific hours or days of the week), and understand where the records and the riskiest areas are located on the map.
The city’s manager for criminality prevention can use the solution to discover locations where the city security police measures should target. Police commanders can use the app to identify most risky areas to which the police officers shall be sent to increase safety of citizens. The public can benefit from the higher awareness about the security-related issues in the city.
Technology
The product is a web-based map application coupled with analytical tools. It runs on WebGLayer (webglayer.org), a unique javascript open source library developed for rendering heatmaps with built-in dynamic data filtering.
Main Features:
- Highly interactive
- Instant reaction to user actions (response time below 100ms)
- visualisation of up to 1.5 million data records
The library is based on WebGL and uses GPU (graphical processing unit) for fast rendering and filtering of data. Using commodity hardware (an average PC) the library can visualise hundreds of thousand of features with several attributes through a heatmap, point symbol map. The library can render the data on the map provided by third party libraries (e.g. Mapbox, OpenLayers, Leaflet, GoogleMap API).
Main advantages of our technology compared to common products on the market:
- Interactive data filtering: Static images cannot provide sufficient representations of data, and a high level of interactivity is desired. Zooming and panning in geographic space is obvious, but interactive data filtering in various views that our solution provides is not a common feature nowadays.
- Scalability: Efficient visualization is a key approach to understand large datasets. Scalability represents one of the key challenges from the perspective of visual encoding (the encoding must overcome visual clutter and over plotting) as well as interactivity performance. Our solution can efficiently visualise up to 1.5 data records while keeping low response times.
- Interaction responsiveness (response time in milliseconds): Once interaction is enabled, the response time is essential. However, large-scale data requires advanced algorithms and approaches. Server side data processing may suffer from network latency. Our solution renders and filters the data on the client side using the GPU, no server side data processing occurs.
- Modest hardware infrastructure demands: Traditional web mapping in geographical information systems (GIS) often demand infrastructure maintenance of spatial databases, and specific server side software such as MapServer or GeoServer.
Data
Incidents reported by the Municipal Police of Plzeň from January 1, 2015 to December 31, 2015.
No. of Data Records: 45216.
Data source: Municipal Police Plzeň http://www.mpplzen.cz/
The data for the first release of the application is provided as a sample DB export. It’s planned for the future that the data will be regularly updated and provided by the city through an API.
NOTE: even though the data was anonymised, it contains sensitive data that the owner of the data currently cannot make public. Therefore, due to security reasons, the dataset is currently not available as open data. The application will therefore be protected by a password and at this stage will not be available to public. However, it can be demonstrated during the hackathon presentations. It’s planned that after future prior agreement with the Municipal Police, a new release of the app might be developed with a subset of data that can be made available to public.
Support
The solution is developed within the PoliVisu project (polivisu.eu)

