
Did you miss our Remote Sensing webinar today? Now you can watch the recording and share it with other interested parties. Thank you.
Agrihub INSPIRE Hackathon 2022: Challenge #2 Analytical tools for WhiteBoard
MENTORS: Runar Bergheim, Karel Charvat, Raitis Berzins
Collaborative analysis for smart farming
The MapWhiteboard is used as an add-on to an application that performs automatic zoning of agricultural fields based on remote sensing data. The application takes as input a field, automatically acquires satellite imagery time series data, calculates indices such as the NVDI and uses the resulting 4D data to determine zones in the respective field that should be treated differently with respect to fertilisation, irrigation and pesticide application.
The MapWhiteboard component adds value to this scenario in two ways:
- Users can indicate points that reside within distinct areas of the field
- Users can modify the resulting zones after auto-classification
- Users can add recommendations, rates to the individual zones
Integrated planning tool
The Map Whiteboard is used as a component supporting collaborative planning processes that involve regional sector authorities, local authorities/municipalities and stakeholders in the planning processes from business/industry/real-estate and NGOs/civil society/organisations.
The traditional planning process requires these stakeholders to work together either separately or, traditionally, in meetings. Much of the interaction concerns maps where people with varying experience in interpreting maps and spatial data work together in meeting rooms on big screens or hunched above printed maps laid out on a table.
The MapWhiteboard augments the meeting experience, allows people to see exactly what is referred to and can add contextual information to better understand exact locations. A person inexperienced in GIS concepts can see the map as if it was Google Maps, can switch to satellite/aerial imagery background and make simple annotations. A more technical user may add WMS services and other contextual information. All can see each other’s pointers.
Generic meeting augmentation tool
Inspired by tools like menti.com which provides polling functions to ensure participative conferences and miro.com which offers a comprehensive digital whiteboard functionality, the MapWhiteboard is in this case used to bring up a map of anywhere on the globe and allow users to cooperate on the surface by drawing and annotating.
After the meeting is ended, the annotations must be saveable, archived for future reference or for export into GIS tools or other visualization solutions.
Ambition of the challenge
Enhancements to Map Whiteboard based technology
- API documentation for both WebSockets and REST API
- Generic authentication options for APIs
- Stability
- Error tolerance
- Reconnect on disconnect
- Race conditions between edits
- Generic plugin for OpenLayers based applications
- Decouple, loosen the demo application from the client-side library and server API
- Packaging of server application
- Installation instructions Windows, Linux
- Deployment
Next steps
- Start a large scale practical deployment of solution.
- Integration with teleconference technologies
- Integration with Hub4Everybody
The registration for the challenges is open! Register for this hackathon challenge HERE.
VIDEO: Hub4Everybody Webinar
Invitation to Remote Sensing Webinar
Whether you are driven by rising input costs to use resources as efficiently as possible or are a fan of modern approaches, we invite you to a webinar on remote sensing in agriculture. We will give individual farmers and more broadly focused professionals a hands-on demonstration of creating application maps from satellite imagery.
The webinar is scheduled on 26/04 at 10 AM CEST.
Venue: virtual
Language: english
Duration: 1 hour
Registration for the webinar is FREE. Register yourself via this link.
Agenda:
10:00 – 10:10 Introduction to Remote Sensing – Heřman Šnevajs
- Satellite systems, purpose of remote sensing Sentinel 1,2, Landsat and how they can help to Agriculture
- What are the advantages and disadvantages of systems, how they can help farmers.
10:10 – 10:20 Field borders – Heřman Šnevajs
- Why we need to detect filed boards or homogenous areas,
- Who can be potential customer
- Prerequisite for further analyses
- Identification of homogeneous fields
- Methods of analysis
- Unsupervised classification – how it can help and where
10:20 – 10:30 Zoning – Dimitrij Kozukh
- What are management zones
- Make your own application map from any (not satellite) image
10:30 – 10:40 Blockchain – Jiří Kvapil
- How it can help in Earth Observation segment
- Sharing and selling spatial data using blockchain
10:40 – 10:55 FarmInsight – A new platform helping farmers with Variable Rate Application – Karel Charvát jr.
- Integration of previous steps
- A tool for end users
Webinar will introduce two challenges of AgriHub INSPIRE Hackathon 2022:
SEMINAR: Use of sensor data in practice
(introduction of pilot applications not only in the Pilsen region)
The seminar takes place on April 28, 2022 in the Úhlava Education Center, o.p.s. in Klatovy, Plánická 174
Program:
9.00 – 9.10 Opening and welcoming of participants – Úhlava, o. P. S.
9.10 – 9.30 Presentation of the project MANDOLIN and DIH – World – Tomáš Mildorf and Kristýna Čerbová, Plan4all z.s.
Working with satellite data
9.30 – 9.50 Sentinel 2 and Sentinel 1 data processing for agriculture (What data can bring us, what are the problems and benefits) – Heřman Šnevajs and Karel Charvát, WirelessInfo
9.50 – 10.00 Generate your own zones – Jan Macura, Wirelessinfo / Dmitrij Kožuch, Plan4All z.s.
10.00 – 10.15 How to ensure the sharing and sale of satellite products using blockchain technology – Jiří Kvapil, Lesprojekt – služby, s.r.o.
10.15 – 10.45 FarmINSIDER – a platform that integrates research results and methods into an application for end users – Karel Charvát jr., Lesprojekt – služby, s.r.o.
10.45 – 10.55 coffee break
Working with sensors
10.55 – 11.10 Presentation of used solutions in agriculture and food transport – Jaroslav Šmejkal, Lesprojekt – služby, s.r.o.
11.10 – 11.30 Hardware solutions in agriculture and food transport – Agronode and Teltonika – Marek Musil, Czech Open Solutions Center spol. s r.o. and Jaroslav Šmejkal, Lesprojekt – služby, s.r.o.
11.30 – 11.40 Senslog – solution for sensor data collection – Michal Kepka, UWB in Pilsen
11.40 – 12.00 Applications for working with sensors (IE20, Dashboard) – Michal Kepka, UWB in Pilsen
12.00 – 12.20 refreshment break
Support for local sales
12.20 – 12.35 Regional specialties and Atlas of regional specialties – Petr Horák, WirelessInfo
12.35 – 12.45 Sales of regional specialties (e-shop) – Radana Šašková, Úhlava, o.p.s., and Tomáš Zelený, Šumavaprodukt, s.r.o.
12.45 – 13.00 What’s next? – Karel Charvát WirelessInfo
The seminar is intended for owners, managers and other managers and organizational staff of agricultural enterprises, producers and distributors and food trade workers with their own logistics. Due to the current pandemic situation, some contributions may be presented online.
Please do not forget to register to participate.
The seminar is held with the financial support of the DIH-World project funded under the European program H2020, grant agreement No. 952176
Hub4Everybody Webinar is coming up!

Do you have digital maps piling up on your computer? For example, results of student work, feeling maps of locations, results of field surveys or scientific experiments? Do you want to publish, promote or discuss the results of your activities across different target groups?
The answer to your requirements is Hub4Everybody, a system for publishing and sharing geographic data, which will be the focus of this webinar and you are cordially invited!
The webinar is scheduled for tomorrow (Friday, 22nd April) at 10 AM CEST.
You can join the webinar for FREE via following link:
![]()
Join Zoom Meeting
https://us06web.zoom.us/j/
Invitation to Hub4Everybody Webinar
Do you have digital maps piling up on your computer? For example, results of student work, feeling maps of locations, results of field surveys or scientific experiments? Do you want to publish, promote or discuss the results of your activities across different target groups?
The answer to your requirements is Hub4Everybody, a system for publishing and sharing geographic data, which will be the focus of this webinar and you are cordially invited!
The objective of this webinar is to introduce a technological solution Hub4Everybody, a basic technology for two challenges defined for the Agrihub INSPIRE Hackathon 2022: Challenge #9 A new social space for geographic information sharing and education and Challenge #12 Building a map based social space for Africa.
The webinar is scheduled on 22/04 at 10 AM CEST.
Registration for the webinar is FREE. Register yourself via this link.
Agrihub INSPIRE Hackathon 2022: Challenge #16 Analysis, processing and standardization of data from agriculture machinery for easier utilization by farmers
MENTOR: Pavel Gnip
Agricultural machinery significantly influences the economic profitability of crop management. How to operate machinery on the field and achieve the best result in farming business? Data collection from running machine in time and location or Meteo sensor on the field can be one of basic controlling for farmers.
Ambition of the challenge
The ambition of the challenge is to prepare tools for quick overview on field data created by machine on the field by selected task for farmers overview and next decision making. Data view and next processing to combine those data with other farm’s data (sensors, labs, other) or open source data for farm practise reason.
Next steps
Verification, data controlling and visualization will be in first step, next step will analyze data with focus on:
- Evaluation of the economic efficiency of machinery operations within the fields – farm
- Precise records of crop management treatments
- Management of machinery operations – increasing the efficiency of planning of crop management
- Control of requirement for field operations:
- Control of pass-to-pass errors and overlaps, coverage of maintained area and recommended work speed
- Control of applied input material in comparison to prescribed rates
- On line monitoring of weeds
- On line monitoring of weather
- ISOxml file from tractor offline
- ISOxml file from tractor online
The registration for the challenges is open! Register for this hackathon challenge HERE.
Agrihub INSPIRE Hackathon 2022: Challenge #4 Climate analysis in the field
MENTORS: Tereza Samanova, Karel Jedlicka, Michal Kepka
In the Autumn AgriHub INSPIRE HACKATHON 2021, the challenge Extreme weather aimed to seek for:
- Exploitation of the possible use of Copernicus Emergency Management services including European Flood Awareness System and European Drought Observatory
- Integration of the information from volunteer observatories of extreme events repositories to provide additional source of information to be assimilated with traditional observations available or to complement missing observations (e.g., hail) to be used for e.g., insurance claims.
- Integration of VGIs and citizen science data to validate/assimilate/train remove observations (e.g., crop diseases, grow monitoring)
As a result, the challenge Extreme weather has discovered that, for farmers, it is not their main problem to make practical use of the awareness and observatory systems, but more to have a look at the micro-climatic conditions and specialties in their properties and their specific parts to plan well the crop management and to prevent potential damages caused by extreme weather conditions. Thus the challenge has, based on brainstorming and discussions within the challenge team prepared a draft project called System of smart growth and crop protection reflecting the current micro-climatic development and weather forecasts respecting the individual position of the field.
Processing of sensor data from very detailed sensor network deployed on large field block showed potential of a completely different level of heterogeneity mapping of such field blocks. The problem is to minimize the number of sensors deployed on the field every season to a reasonable amount. When the initial zoning is defined, external data sources can be utilized to model conditions in particular zones of such field blocks based on historical locality conditions and model predictions.
Ambition of the challenge
The concept of the above-described project needs to be validated in multiple locations in CZ and SK, respecting their individual conditions (latitude, altitude, average precipitation, windiness and other indicators of local microclima). Thus, the inclusion of the experimental farms into this challenge is crucial.
On the other hand, the challenge will be seeking also for the existing examples of good practices already running within experimental smart farming systems and systems of observation and measurements in the fields that deals with weather and climate conditions monitoring.
- The aim of this challenge will be, therefore:
- Collect the relevant examples from practice
- Validate the theoretical basis of the System of smart growth and crop protection
- Develop substance of new product (system) able to enter soon on the market working with observations, measurements, sensors and predictions dealing with weather forecasts and climatic conditions that would help farmers with management of their properties/lands/fields within the principle of smart farming, respecting the climate, weather and specific micro-climatic conditions.
The main ambition of the insitu observations assessment is to define the critical number of sensors for a zoning definition and sustainability of such zoning for further seasons with support of available global data and models.
Next steps
The challenge continues and more develops the former topic Extreme weather and meets the current needs and requirements of the farmers: they are not keen on macro-data collection but on having access to the history and prediction of the conditions in their individual property. The challenge will collect best practices and data available within similar EU and national projects and forward the technological solution (System of smart growth and crop protection reflecting the current micro-climatic development and weather forecasts respecting the individual position of the field) towards its introduction on the market.
It can help farmers to get very detailed information about the field blocks and improve the variability of interventions planning and applications to minimize expensive inputs.
The registration for the challenges is open! Register for this hackathon challenge HERE.
Agrihub INSPIRE Hackathon 2022: Challenge #6 IoT and EO data integration
MENTORS: Karel Charvát, Michal Kepka
The solution developed under the SmartAgriHubs project in the scope of the Flagship Innovation Experiment FIE20 Groundwater and meteo sensors is an expert system to support farmers in decision-making process and planning process of field interventions. This FIE20 solution integrates various data sources and different analytical processes in a complete system and provides users an easy-to-use web map application as a common user interface. The FIE20 system integrates components developed during the SmartAgriHubs project with results and components developed during previous European research projects – namely FOODIE, DataBio and EUXDAT. The FIE20 solution utilizes components of the SmartAgriHubs Digital Innovation Hub where it is deployed and it uses services from individual DIHs of team members, especially cloud services for data storage and large computations.
The FIE20 solution integrates different types of data – local sensor data and online analysis based on this data, Earth Observation and remote sensing data, farm and regional thematic spatial data, weather model and forecast data – to be visualized in web application and used in implemented analytical functions. Available analytical functions provide decision-support results oriented on fields status and conditions, support based on long-term data from EO observations, weather models and measurements.
The web map application provides overview of the locality with visualization of different thematic spatial data on local or regional level, Earth Observation data and various indices. The web map application provides weather forecasts for the locality of the farm and different analyses based on the weather forecast and the forecast model data. Various analytical functions based on spatial and EO data are available in the web map application, these analyses provide information oriented on fields and crops on fields in different stages. Data layers providing – yield productivity zones delimitation from the long time period data, fertilizers variable application maps and NDVI index daily average trend from short time period data represent products of EO data and analytical functions.
The main agricultural challenges that the FIE20 solution is addressing can be divided in three parts. Firstly, the challenge is to integrate various and heterogeneous data from different sources to one system and to present this integrated data in an usable and understandable form to farmers. Secondly, utilization of integrated data in combination with external services in a set of analytical functions to provide farmers enough information as a support of decisions. And last but not least, the way how to visualize and present results of analyses to extract information and added values by the most of users of the solution. The solution utilizes a combination of cartographic visualizations, interactive charts and diagrams.
Introduction/Context
The software solution developed during the FIE20 experiment utilizes advantages of Digital Innovation Hubs (DIHs) as a web platform for its hosting on one side and data services and functions provided by different DIHs for its analytical functions on the other side.
The architecture of the FIE20 solution follows the 3-tier architecture design. It has the data access layer represented by the central database and the cloud storage for EO data. The logic layer provides all functionalities of the application and analytical functions. Components of the logic layer of the solution are developed as modular components providing scalability and interoperability of the solution. Presentation layer is represented by a web map application with individual components for visualization of sensor data, analytical functions and layer management.
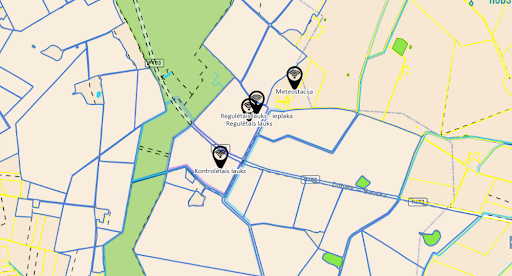
The FIE 20 solution uses an open-source component called SensLog as a sensor data management component that integrates data from meteostations, soil sensors and groundwater nodes deployed on fields to own data storage. These sensor data can be integrated from sensors directly or from sensor manufactures’ clouds. The SensLog solution provides integrated sensor data by system of web services to other components of the solution.
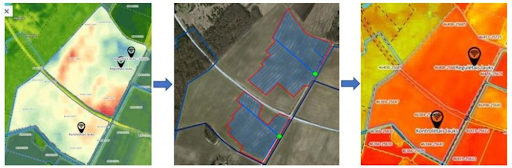
Remote sensing (RS) data are represented by utilization of the Copernicus programme products, namely Sentinel 2 data and different vegetation indices. These RS data are used mainly as inputs for analytical functions and partly as thematic products for visualization. The FIE20 solution provides analyses based on short-time – represented by the NDVI daily average trend as well as long-time period of RS data – represented by the yield productivity zones delimitation. The analyzes utilizing RS data are implemented using Jupyter Notebook platform and components of the EUXDAT e-Infrastructure. This part of analytical components are easily scalable and modificable due to running on the WirelessInfo Innovation Hub.
Ambition of the challenge
The innovative aspect of the challenge 6 is mainly represented by integration of various data from different providers in one web map application together with analytical functionalities and tools provided by different platforms and DIHs. Sensor data are downloaded to the central data storage in harmonized data model from different data providers infrastructures and interfaces. These integrated sensor data are provided by a set of web services to other components of the solution or by standardized interface based on the OGC SensorThingsAPI specification to other third parties components.
Copernicus programme products are utilized for analyses on regional and field level, not only visualization of time-series of vegetation indices are provided, but these EO data are used for analytical functions. On regional level, differences of vegetation indices during the growing season are regularly calculated and visualized in form of charts. Characteristics of fields in the locality from the yield productivity aspect are calculated from the long-term series of satellite data. These characteristics are utilized for calculations of application maps during vegetation seasons. Utilization of weather forecast and weather model data for analytical functions providing predictions is supporting interventions planning on farms.
The challenge 6 solution will supports sustainability of agriculture by several aspects, but mainly by efficiency of resource consumptions. Utilization of fields characteristics based on long-term EO data provides data source for calculations of variable application maps for application of pesticides and fertilizations. Calculation of yield productivity zones provides input for effective application of fertilizers on additive or compensatory methods. Utilization of short-term EO data in combination with weather forecast provides supporting information for intervention planning in next few days. Available analyses based on weather forecast and weather model data provide important information for planning of optimal time period for field interventions and reducing cases of non-effective utilizations of sources.
Next steps
The next step is to integrate new tools like dashboard and integrate this solution with other Farm Management Systems, integrate functions from other challenges and provided large scale testing.
The registration for the challenges is open! Register for this hackathon challenge HERE.