MENTORS: Karel Charvát, Michal Kepka
The solution developed under the SmartAgriHubs project in the scope of the Flagship Innovation Experiment FIE20 Groundwater and meteo sensors is an expert system to support farmers in decision-making process and planning process of field interventions. This FIE20 solution integrates various data sources and different analytical processes in a complete system and provides users an easy-to-use web map application as a common user interface. The FIE20 system integrates components developed during the SmartAgriHubs project with results and components developed during previous European research projects – namely FOODIE, DataBio and EUXDAT. The FIE20 solution utilizes components of the SmartAgriHubs Digital Innovation Hub where it is deployed and it uses services from individual DIHs of team members, especially cloud services for data storage and large computations.
The FIE20 solution integrates different types of data – local sensor data and online analysis based on this data, Earth Observation and remote sensing data, farm and regional thematic spatial data, weather model and forecast data – to be visualized in web application and used in implemented analytical functions. Available analytical functions provide decision-support results oriented on fields status and conditions, support based on long-term data from EO observations, weather models and measurements.
The web map application provides overview of the locality with visualization of different thematic spatial data on local or regional level, Earth Observation data and various indices. The web map application provides weather forecasts for the locality of the farm and different analyses based on the weather forecast and the forecast model data. Various analytical functions based on spatial and EO data are available in the web map application, these analyses provide information oriented on fields and crops on fields in different stages. Data layers providing – yield productivity zones delimitation from the long time period data, fertilizers variable application maps and NDVI index daily average trend from short time period data represent products of EO data and analytical functions.
The main agricultural challenges that the FIE20 solution is addressing can be divided in three parts. Firstly, the challenge is to integrate various and heterogeneous data from different sources to one system and to present this integrated data in an usable and understandable form to farmers. Secondly, utilization of integrated data in combination with external services in a set of analytical functions to provide farmers enough information as a support of decisions. And last but not least, the way how to visualize and present results of analyses to extract information and added values by the most of users of the solution. The solution utilizes a combination of cartographic visualizations, interactive charts and diagrams.
Introduction/Context
The software solution developed during the FIE20 experiment utilizes advantages of Digital Innovation Hubs (DIHs) as a web platform for its hosting on one side and data services and functions provided by different DIHs for its analytical functions on the other side.
The architecture of the FIE20 solution follows the 3-tier architecture design. It has the data access layer represented by the central database and the cloud storage for EO data. The logic layer provides all functionalities of the application and analytical functions. Components of the logic layer of the solution are developed as modular components providing scalability and interoperability of the solution. Presentation layer is represented by a web map application with individual components for visualization of sensor data, analytical functions and layer management.
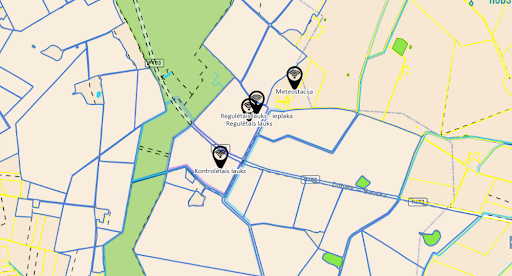
The FIE 20 solution uses an open-source component called SensLog as a sensor data management component that integrates data from meteostations, soil sensors and groundwater nodes deployed on fields to own data storage. These sensor data can be integrated from sensors directly or from sensor manufactures’ clouds. The SensLog solution provides integrated sensor data by system of web services to other components of the solution.
Remote sensing (RS) data are represented by utilization of the Copernicus programme products, namely Sentinel 2 data and different vegetation indices. These RS data are used mainly as inputs for analytical functions and partly as thematic products for visualization. The FIE20 solution provides analyses based on short-time – represented by the NDVI daily average trend as well as long-time period of RS data – represented by the yield productivity zones delimitation. The analyzes utilizing RS data are implemented using Jupyter Notebook platform and components of the EUXDAT e-Infrastructure. This part of analytical components are easily scalable and modificable due to running on the WirelessInfo Innovation Hub.
Ambition of the challenge
The innovative aspect of the challenge 6 is mainly represented by integration of various data from different providers in one web map application together with analytical functionalities and tools provided by different platforms and DIHs. Sensor data are downloaded to the central data storage in harmonized data model from different data providers infrastructures and interfaces. These integrated sensor data are provided by a set of web services to other components of the solution or by standardized interface based on the OGC SensorThingsAPI specification to other third parties components.
Copernicus programme products are utilized for analyses on regional and field level, not only visualization of time-series of vegetation indices are provided, but these EO data are used for analytical functions. On regional level, differences of vegetation indices during the growing season are regularly calculated and visualized in form of charts. Characteristics of fields in the locality from the yield productivity aspect are calculated from the long-term series of satellite data. These characteristics are utilized for calculations of application maps during vegetation seasons. Utilization of weather forecast and weather model data for analytical functions providing predictions is supporting interventions planning on farms.
The challenge 6 solution will supports sustainability of agriculture by several aspects, but mainly by efficiency of resource consumptions. Utilization of fields characteristics based on long-term EO data provides data source for calculations of variable application maps for application of pesticides and fertilizations. Calculation of yield productivity zones provides input for effective application of fertilizers on additive or compensatory methods. Utilization of short-term EO data in combination with weather forecast provides supporting information for intervention planning in next few days. Available analyses based on weather forecast and weather model data provide important information for planning of optimal time period for field interventions and reducing cases of non-effective utilizations of sources.
Next steps
The next step is to integrate new tools like dashboard and integrate this solution with other Farm Management Systems, integrate functions from other challenges and provided large scale testing.
The registration for the challenges is open! Register for this hackathon challenge HERE.


