
Mentor: Jiri Kvapil
The amount of water available during the crop plantation phase is one of the key factors involving quality and quantity of agriculture production. Knowing current soil moisture and its development is very important for both irrigated and non-irrigated arable land cultivation. Spatial heterogeneity of soil moisture can vary substantially, it is challenging to cover larger fields using in-situ measurements even with IoT powered wireless sensor network (WSN). Satellite data help to overcome this shortage, however cloud coverage might waste the whole image when working with optical data. Luckily, radar satellite data is available, but their processing is not at all trivial task and requires a lot of theoretical knowledge and practical skills.
Challenge 1 will be focused on soil moisture measurement from Sentinel 1 satellite radar data in comparison to WSN in-situ data and Sentinel 2 optical data. For green plants there is a relation among soil moisture, surface temperature and amount of chlorophyll.
Main objective of Challenge 1 would be soil moisture assessing and finding and mapping of any relevant correlations between optical and radar data to densify optical data with radar data for periods of cloud coverage, when optical data can’t be used. For practical calibration and verifications of results, in-situ WSN soil moisture data is available.
Tools available to challenge participants
Web-based JupyterHub environment exposing a set of powerful Python-based spatial data visualisation, analysis and manipulating tools will be available. These are GeoPandas, eo-learn and many others allowing for spatial and satellite imagery analysis using your web browser and working on a remote JupyterHub server. Apart from that, set of other third-party tools is also available on the server- just mentioning some of them – GDAL, Orfeo Toolbox, GRASS, QGIS API, etc. But that is not all, users can even use custom developed and focused tools aiming at data processing, visualisation and publication – mostly LayMan and SensLog.
Layman is a tool to facilitate the management of spatial data, SensLog is focused on sensor data manipulation. There is even QGIS plugin available allowing for easy publication of map compositions as map services.
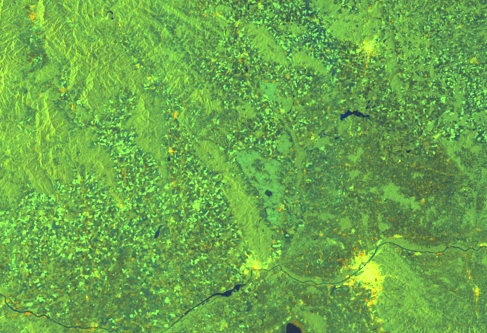
Sentinel 1 and Sentinel 2 images from target locality will be available to event participants for satellite imagery classification workflows. Sentinel 2 images are available in L2A level of processing, i.e. after atmospheric corrections, whose have already been calculated for your convenience including NDVI images (see example below).
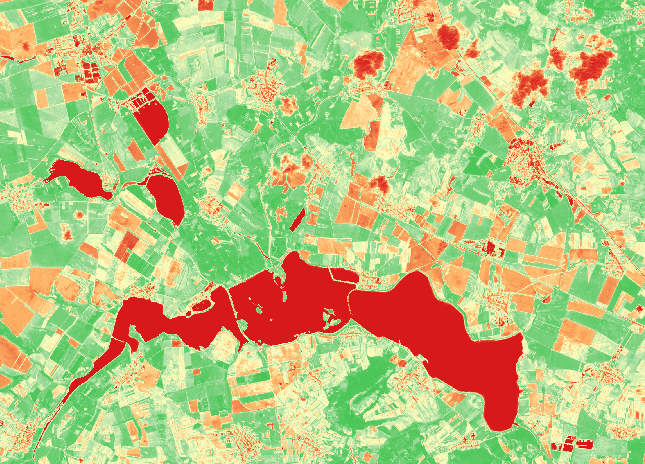
Hackathon participants can utilize tools for unsupervised or supervised classifications of optical data using both statistical and neural network-based methods as well as the calculation of various vegetation or other indices, try to estimate the type of land cover, classify the type of crops, etc.
For Sentinel 1 data the amount of available server based tools is very limited, usage of SNAP software is advisable for radar data processing.