Why is the traditional knowledge of African agriculture disappearing?

The young generation of smallholder farmers aren’t aware of indigenous knowledge.

Indeed, Africa farmers are mostly experiencing modern agriculture using imported inputs letting expect better productivity than in former times led by their old parents. Nevertheless African agriculture is still unproductive and the food deficit is increasing in many areas of Africa.

The indigenous knowledge in agriculture is not learned at modern schools and there is a common agreement asserting that indigenous knowledge in agriculture doesn’t matter.

The traditional languages what are the support of indigenous knowledge are also shrinking as well as indigenous knowledge mostly used in climate change resilience; in choosing right period of seeding by best weather forecasting; in mixing crops for best productivity; in storage crops during a long-run, in preparing seeds and planting required to face a long dry season and so on.

In the same few scarce seeds for feeding the population in periods of hunger as well as serving for medicines for humans and for domestic animals are disappearing due to the lack of know-how in the field, disappointed by modern technologies used in agriculture and livestock in a lot of remote rural areas of Africa.

Agenda:

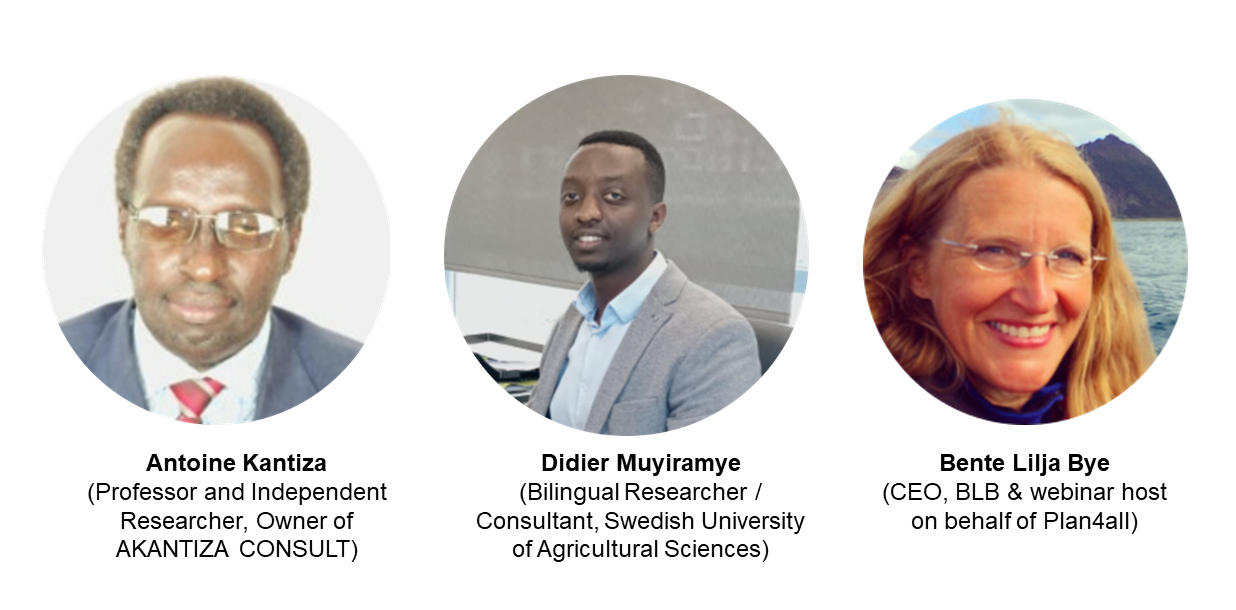
  • Antoine Kantiza: Why is the traditional knowledge of African agriculture disappearing?
  • Didier Muyiramye: Documentation and Dissemination of African Agriculture Indigenous Knowledge: The role of digital technologies in bridguing the knowledge gaps

You will hear from 

Introduction to Business Plan: What is it, what does it it and how to care about it?

Most people want to start their business just by jumping in and doing «it». If they would dedicate some time to the planning and forming a sensible business plan, they would save both time and money. So let’s take a look at how they are formed in ESA BIC Prague.

Agenda:

  • What is the Business plan?
  • Lean canvas
  • TRL
  • SWAT an risks
  • Market analysis
  • Gantt chart
  • Conclusion

You will hear from

SIEUSOIL Press Release

Soil health has raised the last few years a significant share of concerns. Investing in research is a key to gathering the best data and developing the best solutions for sustainable soil management.

Soils are essential for all life-sustaining processes on earth. However, they are facing several pressures and are also heavily affected by climate change and erosion.

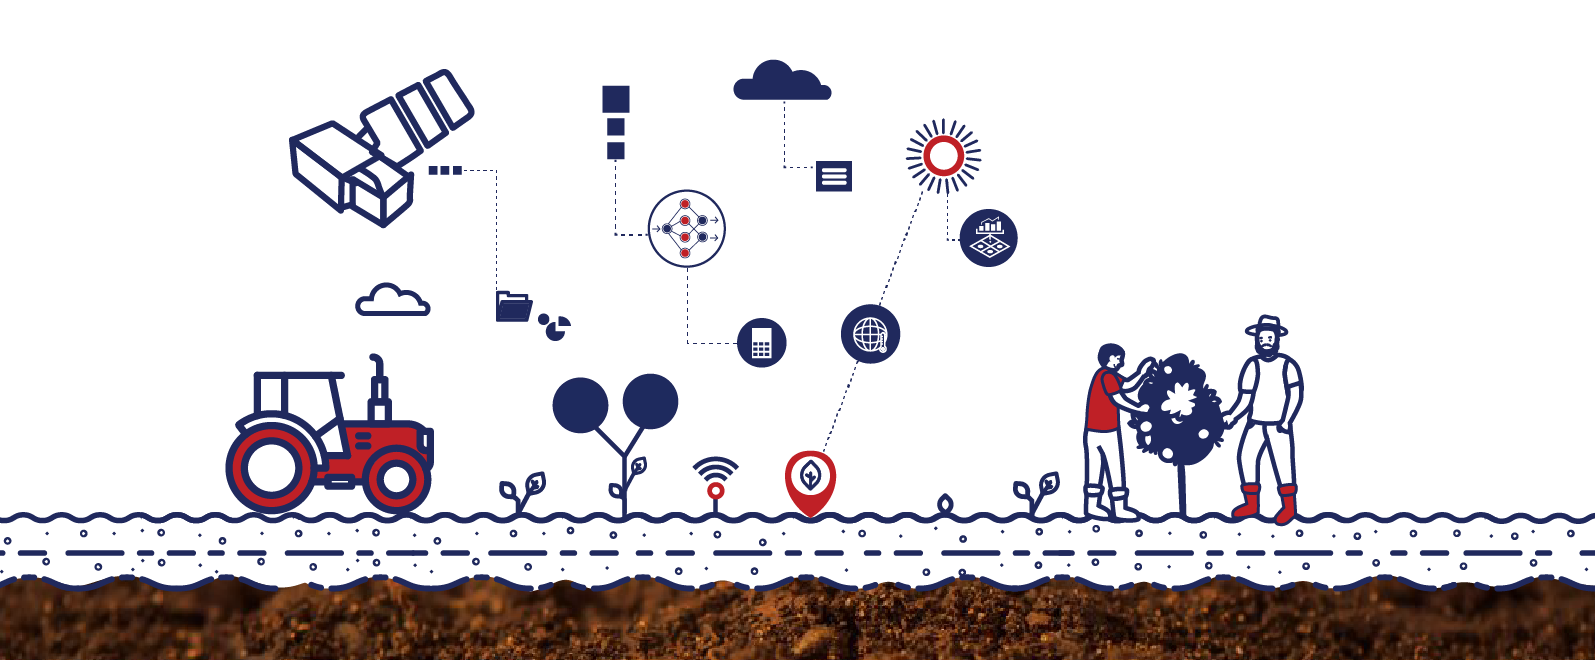
The SIEUSOIL research project which is supported by the Research and Innovation programme HORIZON 2020, aims to develop sustainable soil management practices based on a harmonised land information system suitable for diverse climate and operation conditions along different EU and China locations.

The project activities in the first 18 months of its lifetime have been successful. Collaboration has been established with key global stakeholders, including the Food and Agriculture Organisation, the International Soil Reference and Information Centre, the Joint Research Center and the European Environment Agency.

The original plan foreseen for the Eurasian Soil Platform development has been outperformed so far. The impact of the SIEUSOIL’s results in terms of the Web Observatory platform is in some areas even greater than foreseen. The data model developed with the SIEUSOIL’s and FAO resources will not only be used for the purposes of the Eurasian soil platform. The developed data model has world-wide impact.

Earth observations-derived biophysical parameters have been made available to the pilot activities in the EU and China, while a set of biophysical quality indicators for soils and crops have been defined and their methodology established.

Accurate prediction models for soil and soil physical parameters have been validated and Management Zone Maps and variable rate fertilization maps have been obtained in certain pilot farms. Prediction of Yield Productivity Zones with satellites’ support and their evaluation using farm machinery measurements seem to have gain a huge attention in the scientific community.

Moreover, certain parameters have been selected for the Land Suitability Analysis tool and its use in the pilot areas.

The pilot-scale Decision Support System (DSS) specifications and a prototype test version have been prepared. The connections among the different components were identified, as well as the dependencies on the external sources of data.

The proposed EU mission “Caring for soil is caring for life” is key for meeting the ambitions of the “Green Deal”, notably the Farm to Fork and Biodiversity Strategy. SIEUSOIL is totally in line with this mission which is the EU’s strategic research agenda regarding soils for the years to come.

***

SIEUSOIL is coordinated by Professor Dimitrios Moshou (dmoshou@auth.gr) of the Aristotle University of Thessaloniki that leads the consortium of 23 partners, 16 based in Europe and 7 in China.

5G Techritory – 3rd Baltic Sea Region 5G Ecosystem Forum – European Digital Innovation Hubs (EDIHs)


The 5G Techritory Forum 2020 will be the third-annual event bringing together the leading minds in 5G deployment in the Baltic Sea Region. The 2020 Forum is projected to assemble 800+ of the leading decisionmakers in policy, business, and infrastructure to increase collaboration and reinforce commitment to joint development.

Register HERE!

During the DAY 1 – 11th November between 10:25 – 11:10 CET, there will be a panel discussion dedicated to European Digital Innovation Hubs (EDIHs).

This discussion will take a look at various topics connected with European Digital Innovation Hubs (EDIHs) – what are the needs and current challenges of the digital transition and innovation, what is the expected role of European Digital Innovation Hubs (EDIHs), what are the European added value based on EDIH networking, and more. Therefore this panel will take a closer look at the digital transformation – how to make it work for people, businesses and the environment, what are the sectors and industries that will benefit from it the most and what is the expected impact of 5G on digital innovation.

Description: The need and current challenges of the digital transition and innovation. Expected role of European Digital Innovation Hubs (EDIHs). European added value based on EDIH networking. Digital transformation -how to make it work for people, businesses and the environment. Sectors and industries that will benefit the most. 5G and its expected impact on digital innovation.

Moderator: Salvis Roga, MOB, Green-Tech Cluster / Kurzemes Business Incubator (confirmed)

Participants:

  • Anne-Marie Sassen, Deputy Head of Unit. DG CONNECT/A2, European Commission (confirmed)
  • Āris Dzērvāns, Deputy State Secretary on Digital Transformation, Ministry of Environmental Protection and Regional Development of the Republic of Latvia (confirmed)
  • Muhammad Ali, Senior Scientist, VTT Technical Research Centre of Finland (confirmed)
  • Petr Uhlir, WIRELESSINFO, EDIH in Czech republic
  • Investment and Development Agency of Latvia (to confirm)

Register HERE!

The full agenda of the 5G Techritory Forum 2020 can be found at https://www.5gtechritory.com/updates2020/agenda

Join the session “Data Driven Innovation in the Agrifood sector: where are we?” on Thursday

This week is very important for the data & AI community in Europe, since BDVA is running the flagship event European Big Data Value Forum. The event counts on a great set of sessions and speakers. You can find more information about the event here.

Registration for this virtual event is for free and available here.

I would like to invite you to join the session “Data Driven Innovation in the Agrifood sector: where are we?” that will be held on Thursday 5 November at 14:00-15:30 CET.

The session will present some relevant data initiatives in the sector (DEMETER, NIVA, AI4EU, DataBio, DjustConnect…) including the perspective of the farmers (WFO, Coldiretti) and will discuss on how Common Data Spaces for Agriculture should look like. For this we will count on the following set of speakers:

  • Nuria Lama (Parallel session chair) European Programmes Manager, Member of the Board of Directors of BDVA, Atos Research and Innovation
  • Ana Antunes (Speaker) Agronomist, SmartRural S.L
  • Giorgio Micheletti (Speaker) Consulting Director, IDC
  • Arne Berre (Speaker) SINTEF and NorwAI
  • Ioanna Roussaki (Speaker) Assistant Professor, National Technical University of Athens
  • Panos Ilias (Speaker) IT Business Analyst – DjustConnect, ILVO
  • Sander Jenssen (Speaker) Team Lead, Wageningen Environmental Research, Team Earth informatics
  • Luisa Volpe (Speaker) Head of Policy Development, World Farmers Organisation
  • Rita Gentili (Speaker) Coldiretti

Join this session on Thursday, contribute to the discussion and help to raise the interest of applying Data and AI technologies to the Agriculture and Food sectors.

EUXDAT Webinar Series – Pilots’ Session 3

The EUXDAT Webinar Series was concluded with the Pilots’ Session 3 following the Pilots’ Sessoin 1 and Pilots’ Session 2.

Please, helps us to get your opinion on the EUXDAT project.by filling in the questionnare.

Agenda of the Webinar:

EUXDAT relevance towards Biodiversity. Karel Charvát (CoO)

Better Land Use Management, Soil Management, Biodiversity Management are important part of European Green and also UN Suspensible Development Goals. The webinar will demonstrate, how with EUXDAT infrastructure is possible to improve Land Use Mapping

Open Land Use Map Scenario. Dimitri Kozhukh (Plan4all)

In the webinar we will introduce output of Open Land Use pilot. There will be part devoted to the creation of Open Land Use Map, part devoted to generation of geomorphological characteristics of the OLU objects (land parcels) and also automatic classification of land cover/ land use from Sentinel-2 imagery.

Crop Monitoring Pilot. Dimitrios Moshou, Ioannis Navrozidis (CERTH)

In the webinar we will introduce output of Crop Monitoring pilot. There will be part devoted to the creation of spectral index creation from Sentinel-2 bands, part devoted to characteristics of the crop stress in olive groves and also automatic classification of stress-disease incidence by SVM from Sentinel-2 imagery.

Discussion and feedback analysis, Karel Charvát (CoO), Jorge Lopez (ATOS)

Challenge #6: Mid-term Report

Let’s read the mid-term report of challenge #6 Atlas of Best Practices – Polirural cases. 

Mentors

  • Petr Horak is mostly responsible for technical development and coordination within the challenge
  • Pavel Kogut is in charge of stakeholder engagement and day-to-day communication with participant

Registrations

Since 3 Sember 2020 when the challenge was first announced by Plan4All, a total of 20 participants signed up to it. Many of those who registered are partners of the PoliRural project. However, a few people are completely external, and some come from outside the EU e.g. Ethiopia, Rwanda. 

Process

Groups

To better manage participants and improve the overall coordination of the challenge, mentors decided to divide people into three groups: 

  • Atlas Consultants: The purpose of this group is to advise the PoliRural tech team on how best to incorporate frontend and backend changes requested by Collectors and Testers to improve the current version of the Atlas. No programming input is expected from Consultants, however it will help if people joining this group have some UX and web development experience.
  • Case Study Collectors: This group will be primarily responsible for gathering case studies (a template will be provided later) that will eventually appear on the Atlas. Additionally, Collectors will need to provide feedback to Developers on how they would like the case studies to be displayed (frontend) and what admin features they would like to use when accessing the Atlas (backend). Collectors are not required to possess any technical skills. What is important is the ability to collect information using desk research and other techniques, as well as to have some basic writing skills (to present the case studies in English) and of course an overarching interest in rural affairs.
  • Prototype Testers: The role of Testers is to assess Atlas improvements implemented within the scope of the Challenge. A special questionnaire will be created to gather structured feedback from Testers several times during the process. People that collect case studies can also volunteer to test the prototype solutions, so it’s possible to be a member of both groups at the same time. No special knowledge or skills are needed to perform testing activities. What’s needed is an impartial assessment of the tool from a layman’s point of view.Welcome email

Webinar

A joint webinar involving the mentors of Challenge 2, 6 and 12 was held on 20 October 2020 at 09:00 CET. Petr Horak presented the overall Atlas architecture and its background (Enabling project), while Pavel Kogut introduced Challenge 6 to the attendees. In his presentation, Pavel first set the context for the challenge by describing some of the problems that rural areas are facing e.g. poverty and social exclusion, lack of public services, negative population dynamics. This part was followed by a quick overview of pressures caused by the pandemic (e.g. demand shocks, falling tourism, logistics bottlenecks) and their impact on rural livelihoods. Next, several good practices for dealing with Covid-induced rural challenges were presented, drawing on the examples from Europe and the US. The presentation ended with the description of Challenge 6, its objectives, groups, and expectations (next steps). The entire slide deck can be found here.

Alpha version 

At the webinar, participants were offered a sneak preview of the Covid Atlas. Currently, it contains two made-up cases that are used only for illustration purposes. In the future, as Collectors supply their case studies to the mentors, the Atlas will be populated with actual stories from across the globe. Eventually, the goal is to integrate the Atlas into the PoliRural Innovation Hub

Case study collection

Shortly after the webinar, Pavel Kogut reached out to interested Collectors and asked them to look for interesting case studies. A template was provided to ensure consistency in data collection, as well as to make further integration with the Atlas easier. First input is expected by early November 2020.

Next steps

Mentors will work on the following in the coming weeks

  • Collating, synthesising and integrating information from Collectors
  • Initiating a series of training sessions with Testers
  • Engaging Consultants with a view to improving the Atlas
  • Capturing feedback for integration in the final report
  • Preparing for the final event

Challenge #13: Mid-term Report

The main goal of the challenge is to calculate agro-climatic factors of a selected area of interest. The second task for this challenge is to analyse inner uncertainty of climatic data provided by the Copernicus ERA5 Land dataset and compare this dataset to the dataset produced by in-situ sensors in pilot localities. 

During the first period of the Challenge No.13 discussion about agro-climatic factors and their selection for forecasting regional food supplies was done. The selected agro-climatic factors are following:

  • frost-free periods, growing degree units, heat stress units, number of (optimal) growing degree days from temperature.
  • nitrogen application window from soil temperature.
  • accumulated solar radiation from incident sunlight.
  • water balance from precipitation, evapotranspiration, and runoff data.

Pilot area of interest was selected and datasets from Copernicus ERA5-Land database was downloaded. The pilot area of interest will be Pilsen region, Czech Republic. For evaluation and comparison of global data versus local in-situ sensors, two small localities were selected. Previous sensor campaigns were organized in these 2 pilot localities. First locality is in southern part of Czech-Moravian Highlands – Kojcice. Second one is in Northern Moravia – Trisce.

We have collected sensor data from locality Kojcice between spring 2016 – winter 2018 from soil sensors and meteostation. We have data from locality Trsice between spring 2015 – autumn 2018 from meteostation. Corresponding phenomena will be collected form the ERA5-Land dataset for both localities. 

First period was mainly oriented on selection of phenomena and factors, selecting area of interest and data collection from global and local perspective.

The team for the Challenge No. 13 consists from 15 members, where mainly EU states are presented, partly Africa and one member from the US. 

Challenge #11: Mid-term Report

Covid19 pandemic and mainly subsequent restrictions was and still is a test for the food supply chain in order to provide enough food to the market to the end customers. Especially in crises a good decision can be made only with enough information.The yield potential is highly prone to the seasonal effects such as drought, floods, optimal amount of rainfall, duration of insolation, temperature and others which can make the predictions highly different from the reality. The goal of challenges is to design methods of monitoring yield and climatic conditions during the season, which can influence negatively or positively yield in the season. 

As the reference layers we use the yield production zones calculated from 2013 – 2019 with the trends during the season of 2018. Temporal trends or events will be analysed on the basis of comparison of yield trends with Sentinel 2 EVI (Enhanced Vegetation Index) Index which is very close to NDVI index. The reason why we have decided to choose EVI index instead of NDVI is that EVI index does not suffer from saturation effect.

Figure 1: Map of yield potential delineated from multi-temporal Landsat imagery

Our aim is to monitor phyto phenology of wheat in Rostenice farm, where we have available data of yield potential, field boundaries geometry and inter alia, the information on the type of crop grown in the field.

Metrics

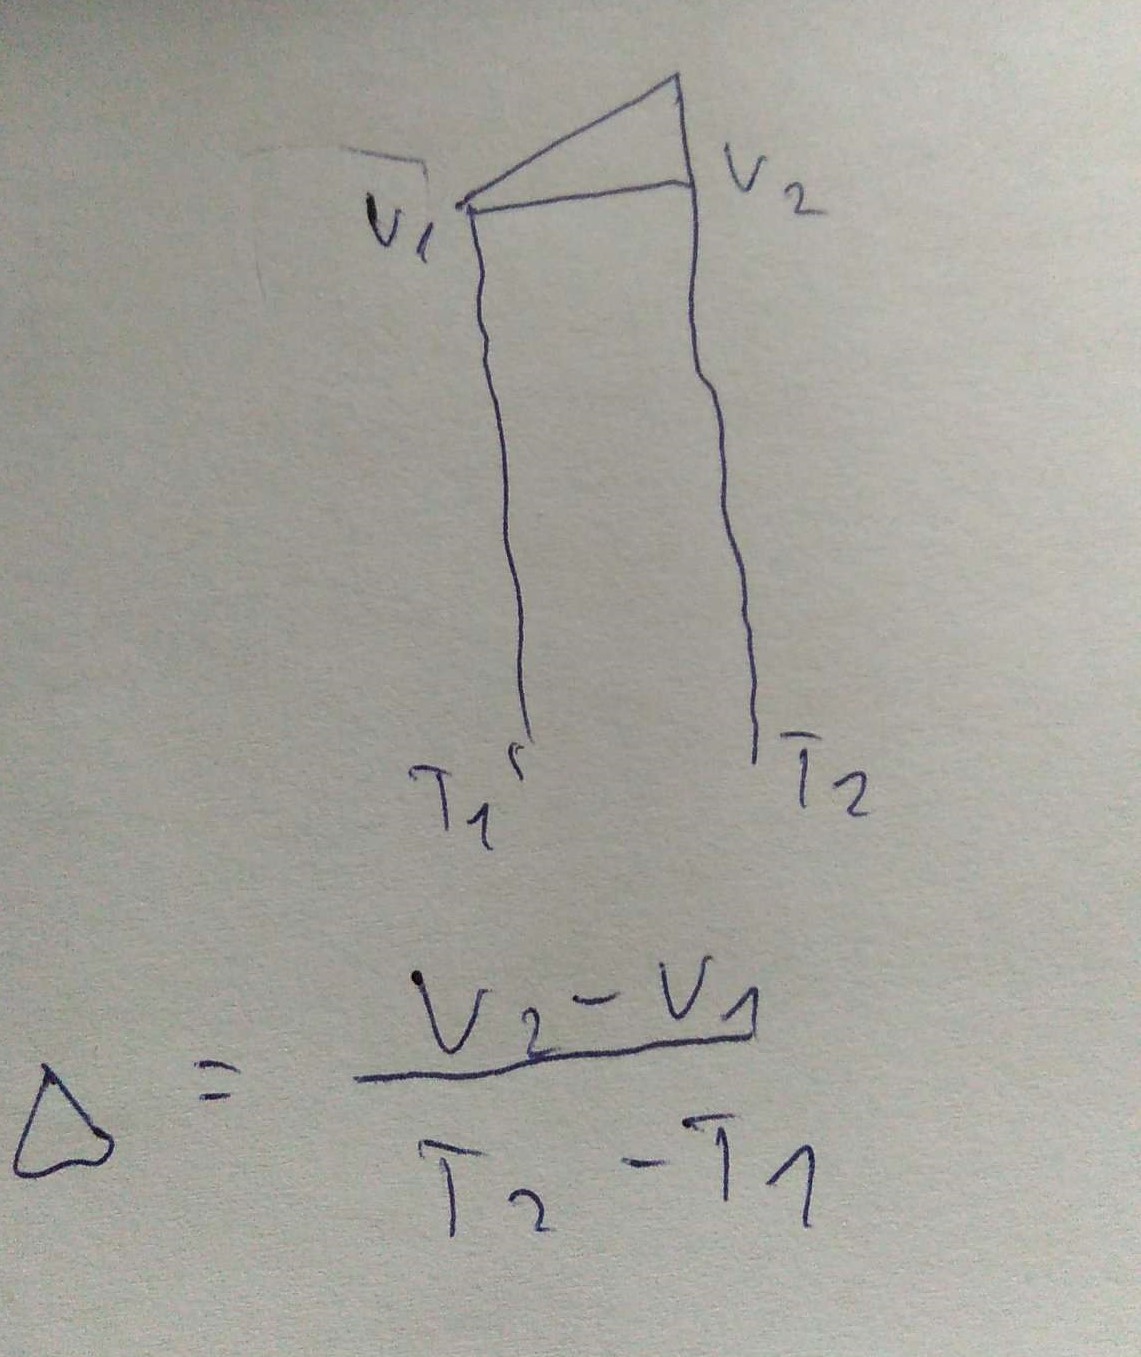
EVI will be calculated for every image where it is not too cloudy. The difference Δ between EVI values in two consecutive images will be calculated using following formula:


Figure 2: Formula to calculate normalized difference between two EVI layers

where v1 and v2 are EVI values of the same pixel and t1 and t2 stands for time in days.We know from previous experience that the difference cannot be negative. The size of the difference value shows how much had the crop (wheat) changed in reality. This information is very useful for measuring the effect of any issue or condition during the season. Thanks to this difference information we will understand better the individual phases in crop growth.

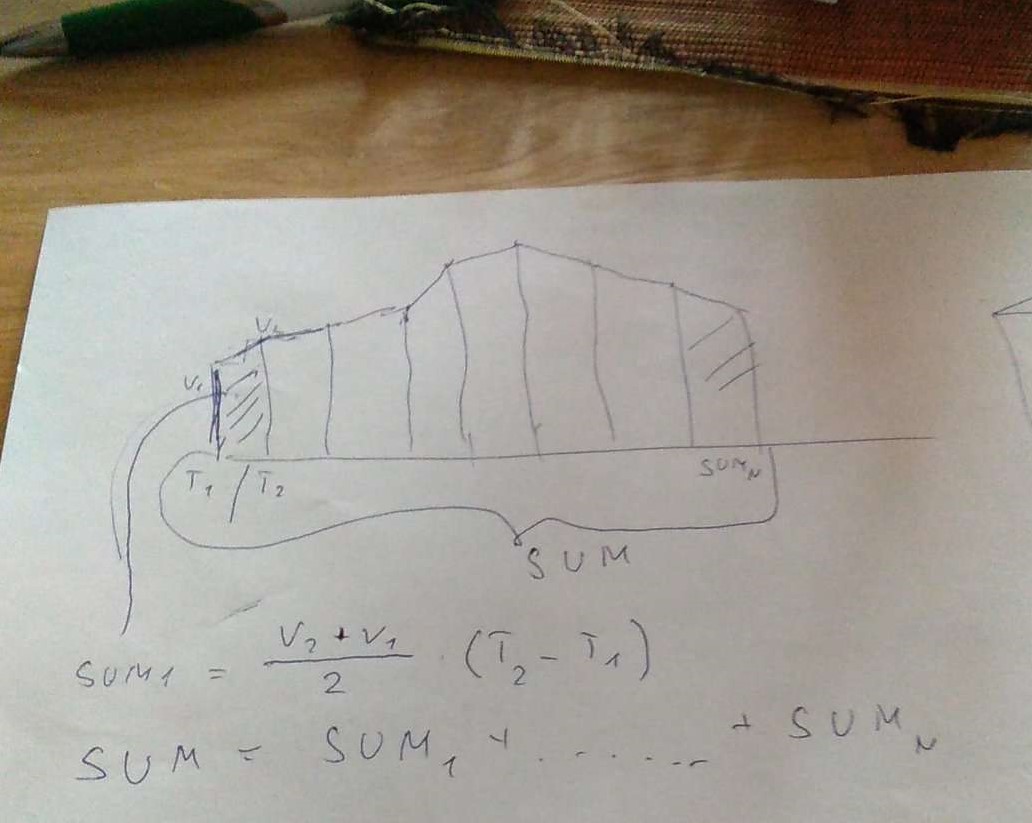
Another way to compare the EVI values is to calculate integral for the whole season. Mathematical formula to calculate integral (SUM) is depicted below:

Figure 3: Formula to calculate integral for the whole season

where again v1 and v2 are EVI values of the same pixel and t1 and t2 stands for time in days. Thanks to integral value we can see where EVI was mostly above the average and which places were under the average most of the season compared to other places in the image.

Last way to compare EVI values will be by simple statistics within chosen fields. When comparing the mean value of some fields, we will learn which field has higher yield potential. We will also compare deviation in order to validate our metrics.

Challenge #8: Mid-term Report

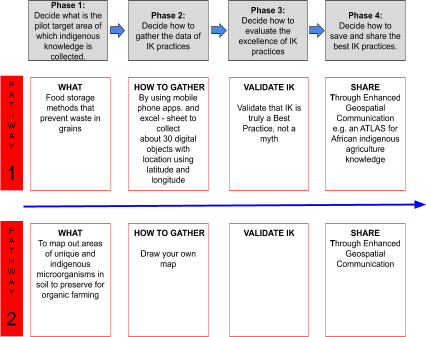
The figure 1 outlines the challenge #8 concept and selected two pathways. The concept encompasses 4 phases; what indigenous knowledge to collect, how to collect, how to evaluate the quality of the knowledge,  and finally how to record and share the indigenous knowledge.  So far we have decided to put effort on two pathways but we are still looking for additional ideas for pathways. Pathway 1 is addressed on grain storage systems in Africa. Pathway 2 is about mapping out soil microbes coverage, quality and quantity in African continent.


Figure 1: The concept of challenge #8

The team of challenge 8 consists of 31members from 17 countries.  Most of the team members are from Africa continent.  The team uses emails, WhatsApp and Skype for communication. WhatsApp is the most active channel having 13 team members. Skype group has also gathered 13 members.  

By 19.10.2020, there have been 3 team meetings: 1 pcs for general, 1 pcs for pathway 1 and 1 pcs for pathway 2.  The discussion, ideation, knowledge transfer could have been more active and vivid, but we are still in a ramp-up phase of the project.  The first results to come will hopefully and activate participants into dialogue.  

The kick-off webinar was planned to be on week 40, but it was necessary to postpone to 23.10.2020 (week 43) due to one presenter’s personal reason. 

Pathway 1 needs support from the challenge 6 expert Peter Horak,  and Pathway 2 from the challenge 3 expert Pavel Hajek. The co-operation between challenges enriches and enables more ambitious deliverables and increases all participants’ know-how and skills. 

At the moment there are no particular risks ahead.  The next tasks are to ideate additional pathways, pilot the 4-step concept and constantly assess the progress. To enhance team dialogue is one of the core tasks.