
This is a report from one of the satellite hackathons organised in the frame of the INSPIRE hackathon series – The Valmiera INSPIRE Hackathon 2018.
Another event from the INSPIRE Hackathon series took place at the Vidzemes University of Applied Sciences (ViA) in Valmiera in Latvia between 30th May and 1st June 2018. The event was organized by the ViA in cooperation with several European projects namely DataBio, NextGEOSS, EUXDAT, PoliVisu and also in cooperation with the Plan4All association.
This Hackathon was focused on introduction of technologies and data sets used in cooperating projects to students of the ViA. The majority of participants of the Hackathon were 2nd year students of the Information technologies programme from the ViA. Students could choose tasks prepared by mentors before start of the event or they could come with own project idea.
Students’ tasks for the Hackathon were derived from following project ideas:
- Visualization of 3D data using CesiumJS library;
- Processing and visualization of sensor data;
- Integration of available datasets to existing databases e.g. Smart Points of Interest (SPOI), Open Land Use (OLU) etc.;
- Design mobile application using open datasets (SPOI, OLU, etc.);
- Analysing and visualization of remote sensing data especially Copernicus datasets;
- Define requirements and design mobile apps using some open datasets;
- Research of available open data in EU countries.
Students were working on selected larger tasks in small groups or alone on particular tasks. Students were discussing issues with mentors and mentors were providing students advices during solution of tasks. Each participating student has presented results of selected task at the end of the event and gave certain feedback of utilization of recommended technologies and datasets.
Interesting results were made in tasks derived from the Visualization of 3D data project. Visualization of temporal 3D data was tested and as well as CZML format data representation. Print screen of tested data set visualization is shown in next Fig 1.
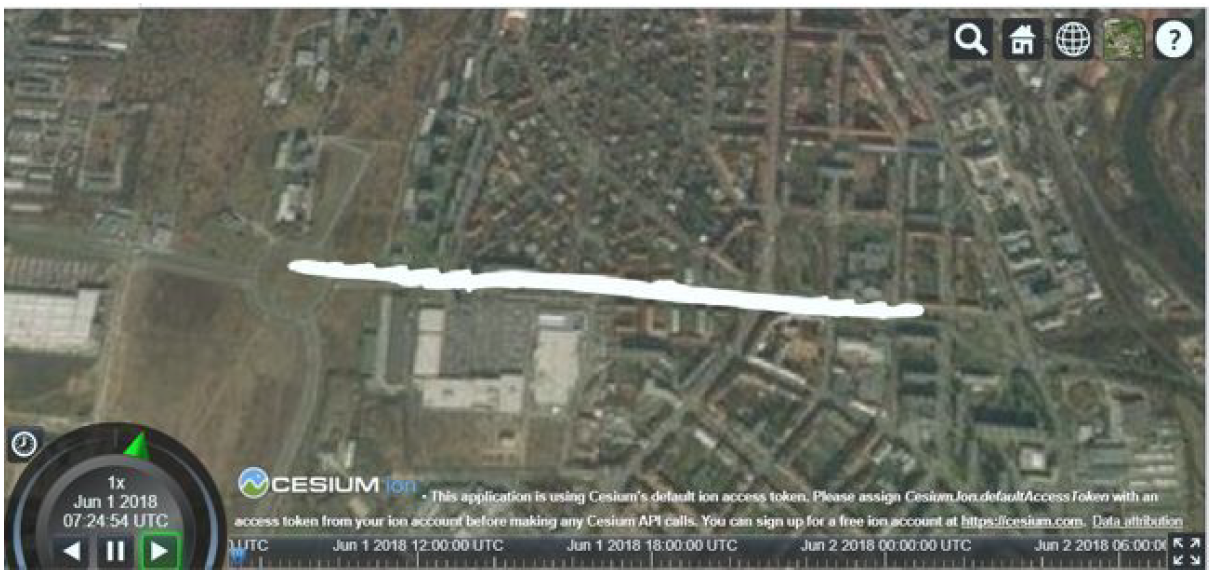
Fig 1 – Visualization of 3D data in CesiumJS library
Several mock-ups and set of requirements for mobile applications were presented as results of tasks derived from the Define requirements and design mobile apps using open datasets project. One proposed mobile app was about gamification of evaluation of restaurants and cafés in France. Another mock-up was describing mobile app that is integrating bike rental services from different companies. This designed application was described up to the level of functionality and screens design as is shown in Fig 2.
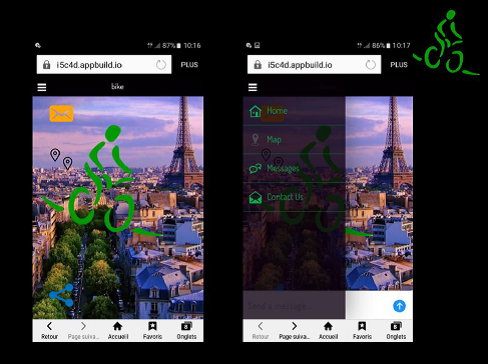
Fig 2 – Screens of designed bike rental mobile app
Results of researches on availability of open data in selected countries or domains showed that the number of open data producers and publishers is increasing. Situation of open data was investigated in Latvia, France, UK and Spain.
Students found this event attractive because it broadened their horizons in the field of modern technologies and datasets with emphasize in the spatial data domain. Students found this event attractive because it broaden their horizons in the field of modern technologies and datasets with emphasis in the spatial data domain. This event brought students an experience how to process tasks in different domains in limited time. Photo from a working and coding session during the Hackathon is shown in Fig 3.
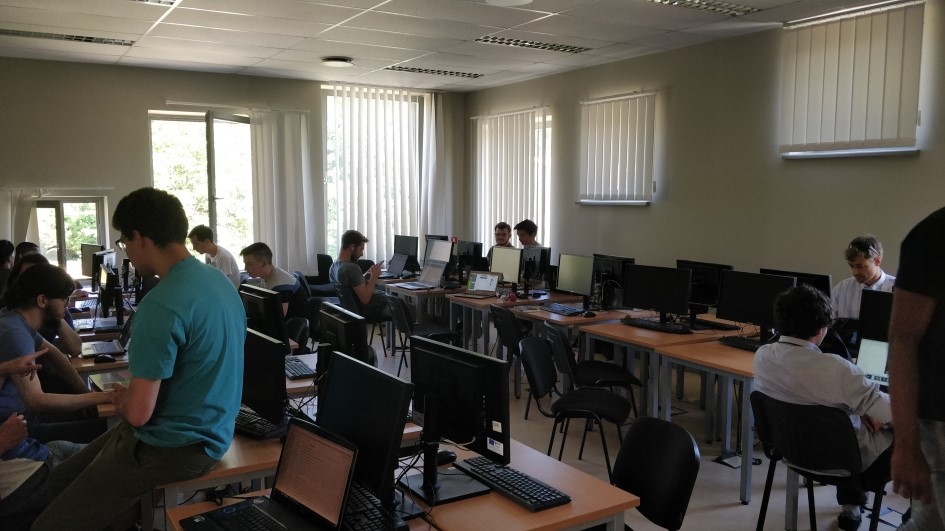
Fig 3 – Coding and working session during the Hackathon
Programme
- Wednesday 30. 5.
- 10:00 – starting of event, introduction of cooperating projects and project ideas
- 12:00 – introduction of students tasks
- 14:00 – start of coding
- 17:00 – wrap up results from first day, end of first day
- Thursday 31. 5.
- 10:00 – start of second day, coding and working on students tasks
- Thu 17:00 – wrap up results of second day, end of second day
- Friday 1. 6.
- 10:00 – start of students presentations
- 13:00 – evaluating results, end of the event