
This is an update from the 3D Open Land Use project.
Integration of Cesium plugin to HS Layers NG
The project was divided into three phases. Firstly, an integration of Cesium into HS Layers NG was realized – this can be tracked on Github See folders examples/3d-olu and components/cesium at https://github.com/hslayers/hslayers-ng repository. There was also created a local copy of Cesium server (http://cesium.cenia.cz/) for better performance.
Visualization of Open Land Use on top of EU-DEM
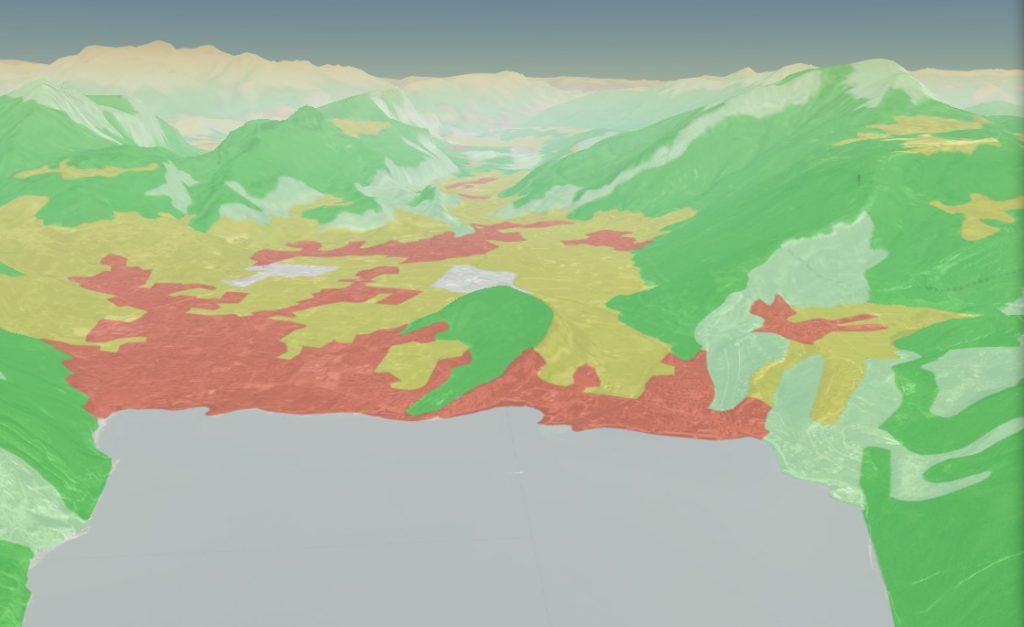
The second phase consisted of visualization of Open Land Use in a perspective view, to allow a 3D exploration of the dataset. When exploring the default cesium terrain source, the team realized that the 30 meter resolution EU-DEM is already incorporated.Therefore the terrain source issue was off the table, as the team is not aware of any other more detailed but open source terrain source available at the moment. The “only” remaining issue to solve was then to visualize the Open Land Use WMS on top of the EU-DEM terrain. As using just one WMS leads to slow response times, the two following optimizations were made:
- The land use is rendered from CORINE data for less detailed zooms. Talking technically: till WMS tiles of smaller scale than 1:200 000 are requested by Cesium. The detailed Open Land Use Map is displayed just in closer zooms.
- For the closer zooms, land use polygons of just visible LAU2 municipalities are shown. The technical realization is as follows:
- Bounding boxes of LAU2 municipalities are confronted with an observer’s line of sight. ID’s of positive matches are retrieved.
- Only Open Land Use polygons of selected LAU2 municipalities are displayed.
The resultant application is depicted on following figure and is accessible at the address http://ng.hslayers.org/examples/3d-olu:
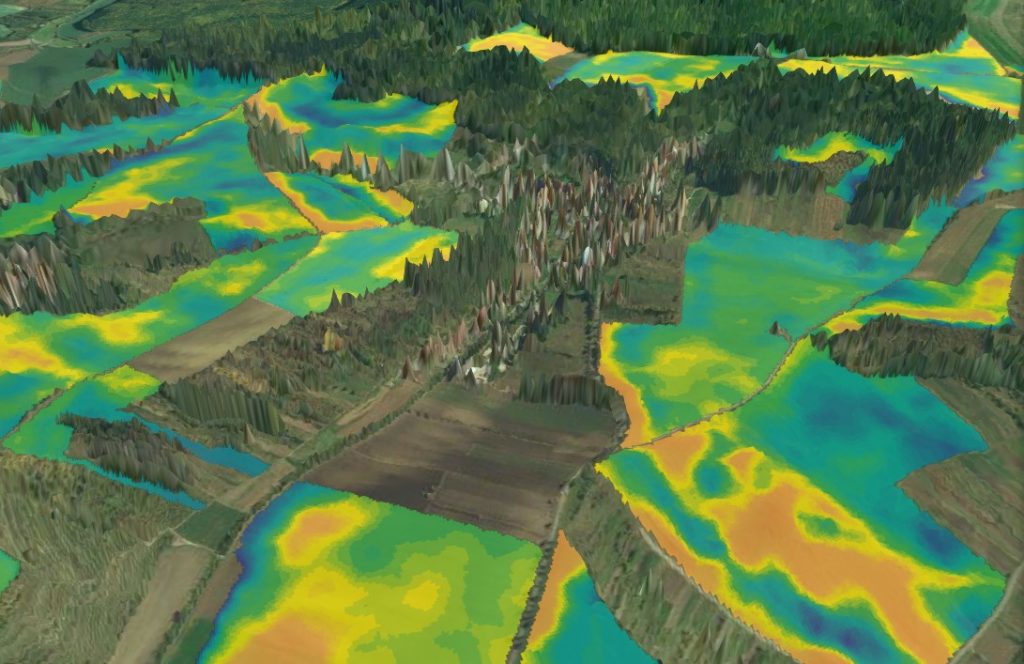
Visualization of yield potential on top of detailed terrain
Third phase of 3D Open Land Use hack activity was focused on visualization in higher detail. Therefore a visualization of yield potential from a particular farm was chosen as a use case. A data about yield potential was calculated for Rostěnice farm (a DataBio project agriculture pilot area). This data was then placed on top of digital terrain and digital surface models produced as services by ČÚZK and a web application showing the data on digital surface model was created. Due to licensing issues there is no public link to the application, but we hope in successful agreement with data provider. Meanwhile, you can see the results at least in following video:
Future development and further ideas
The majority of the initial ideas have been achieved, but there are new ideas coming, such e.g. as:
- Displaying detailed information about the OLU categories on click.
- Exploring information about the correlation of yield potential value, local slope and aspect.
- Displaying machinery paths on field.
- Calculation of (at least rough) yield potential or fruit type detection from satellite data.
- …
Thus, our team is still open to new developers wanting to join.