
During the DataBio code camp in Darmstadt (27-29 March 2018) the web map application that displays data from selected WMS Time (WMS-T) services (main physical and bio indicators of the water such as water temperature, water salinity, chlorophyll concentration etc.) from Copernicus Marine Environment Monitoring Services (CMEMS) web-page (http://marine.copernicus.eu) as well as some custom WMS-T services that are needed for DataBio project was created. The application is currently running at http://ng.hslayers.org/examples/databiocc . It is based on the HSLayers.js library (http://ng.hslayers.org/) . This example is a 3d extension of HSLayers which is based on the CESIUM platform.
The application provides an easy visual way to browse the data available at CMEMS web page. For someone it could be a tool to explore and discover something interesting from the maps about the world, and for someone, like, scientists a visual way to explore the data before they decide on whether they would like to go to CMEMS web page and download raw data and use it in their analysis.
Future plans include visualisation of more WMS-T services. Currently displayed WMS-T services from CMEMS have two dimensions in fact time and depth. For now, the user can select only time dimension and the depth is by default set to nearly surface water level. The application could be extended by a slider for the depth level.
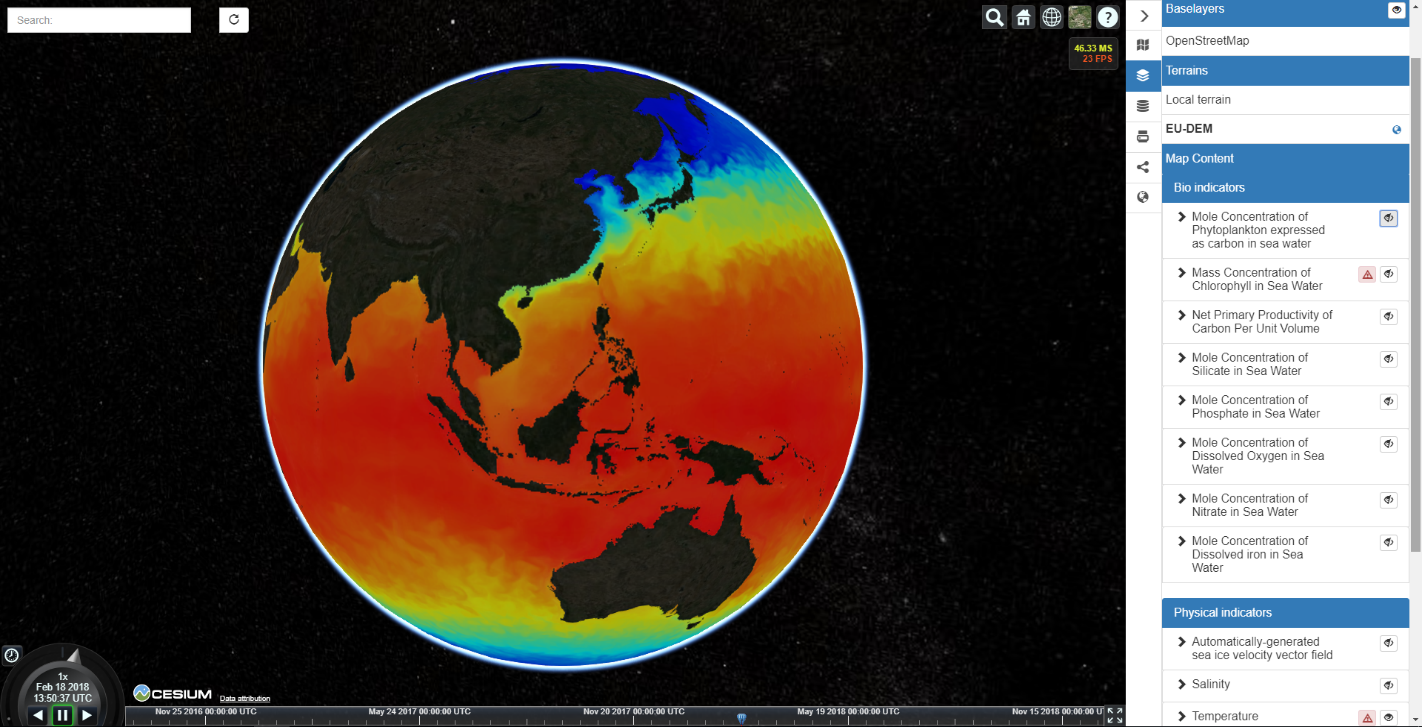
Figure 1 Ocean temperature
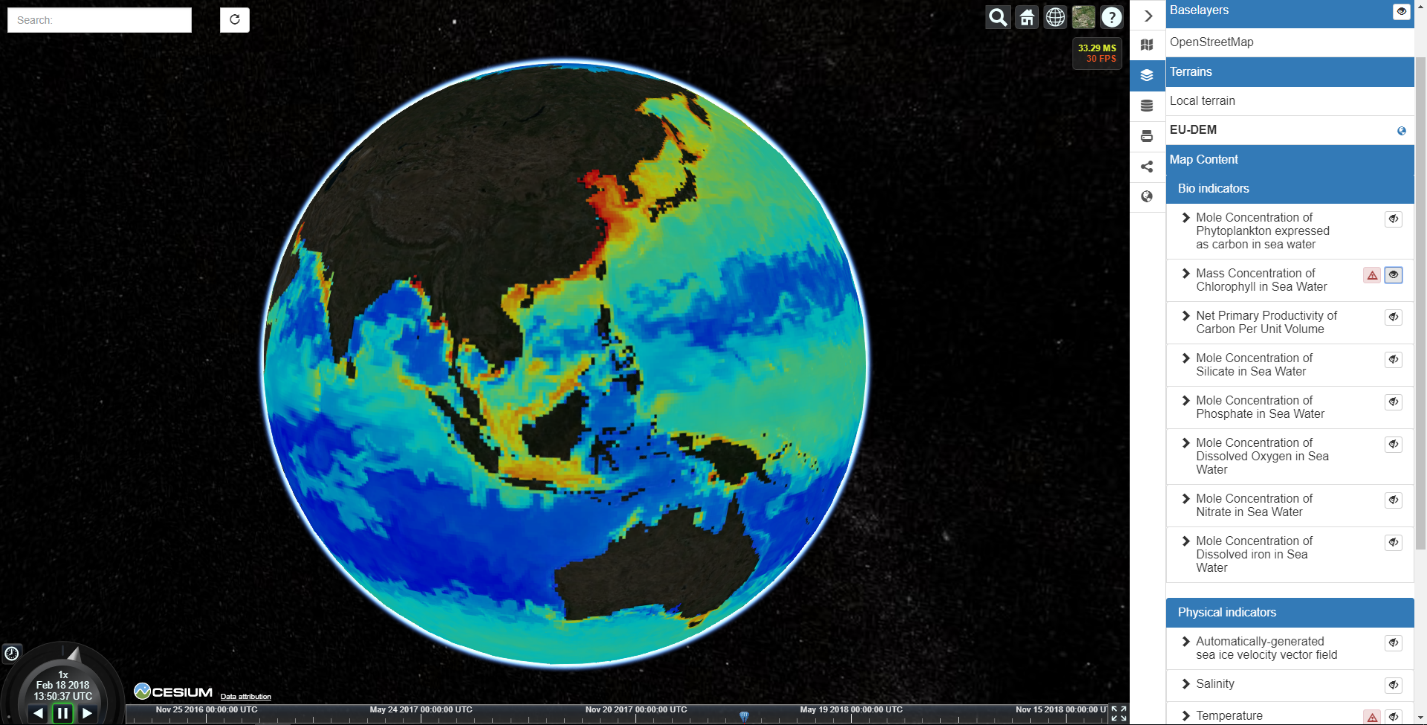
Figure 2 Chlorophyll concentration in the ocean
[Author Dmitrii Kozhukh]