
MENTOR: Michal Kepka
Introduction/Context
Sensor data provides important part of spatial data at all. Especially with spreading of IoT across different domains, huge amount of sensor data can be produced in a short time period. The problem arises with large amount of sensor data collected during observation campaign. The first task is to filter and clean non-valid observations and check periods of data loss or drop-outs. The second task is to prepare initial aggregations of data – hourly/daily/monthly averages, minimums, maximums, sums of selected observed properties. The next step is to prepare analyses based on the target usage of observed data. The last but not the least point is to prepare understandable and usable visualizations of observed and processed data in an explanatory way.
Ambition of the challenge
The challenge should provide extension of the current data flow through the SensLog system and its components to improve the analytical functionality and client-side visualization of observed and analysed data.
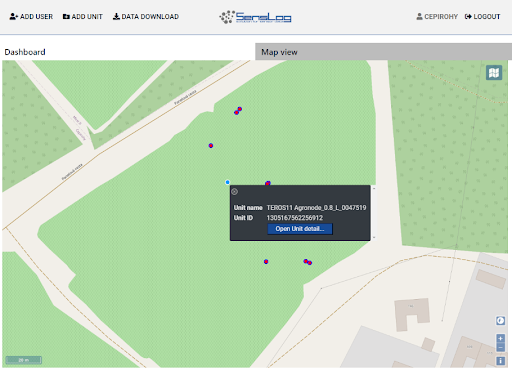
Map window for static sensor nodes
Analytical functions need to reflect current options of data sources – mobile sensors on machinery and delivery pick-ups and large set of static sensor nodes. The set of analytical functions should reflect target domain of the data usage and expected form of analyses. Analytical functions should process collected data as well as integrate data from external sources – remote sensing data, models and simulations. These external datasets can be future observations or predicted values thus the visualization client should be able to distinguish between real and predicted data.
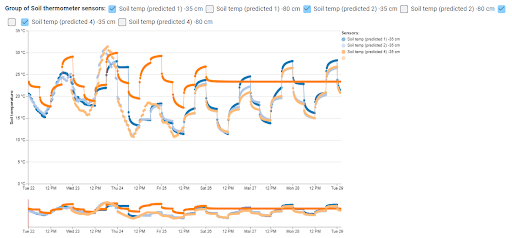
Visualization of predicted data
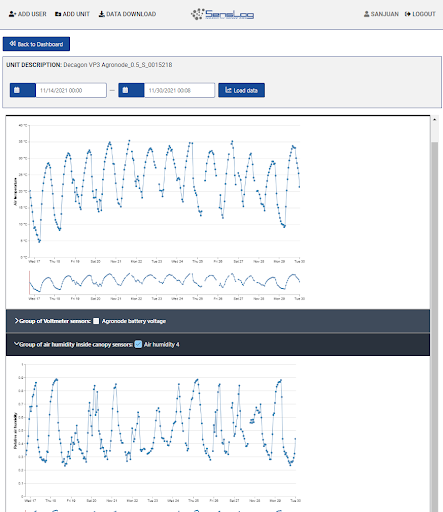
Chart visualization for different observed properties of static nodes
Next steps
The challenge will use the SensLog system and its components and data from selected sensor campaigns provided by sensor owners. Challenge task list can be extended by requirements defined by potential end-users of the data flow and client application.
The registration for the challenges is open! Register for this hackathon challenge HERE.