The Regional Centre for Mapping of Resources for Development (RCMRD) is an intergovernmental organization that seeks to promote sustainable development through generation, application and dissemination of Geo-Information and allied Information to its 20 member states and stakeholders.
RCMRD works with its partners to promote the co-development, application and uptake of satellite derived products. This is achieved by making tools, applications and data and information more readily available through different initiatives. Some of the freely available tools are listed below.
RCMRD Geoportal & Open Data Portal
The geoportal and open data portal are repositories for datasets, maps and freely available satellite imagery. The open data portal also provides links to RCMRD application portals by thematic area, hazard maps and atlases and additional functionality to interact with a diverse set of datasets.
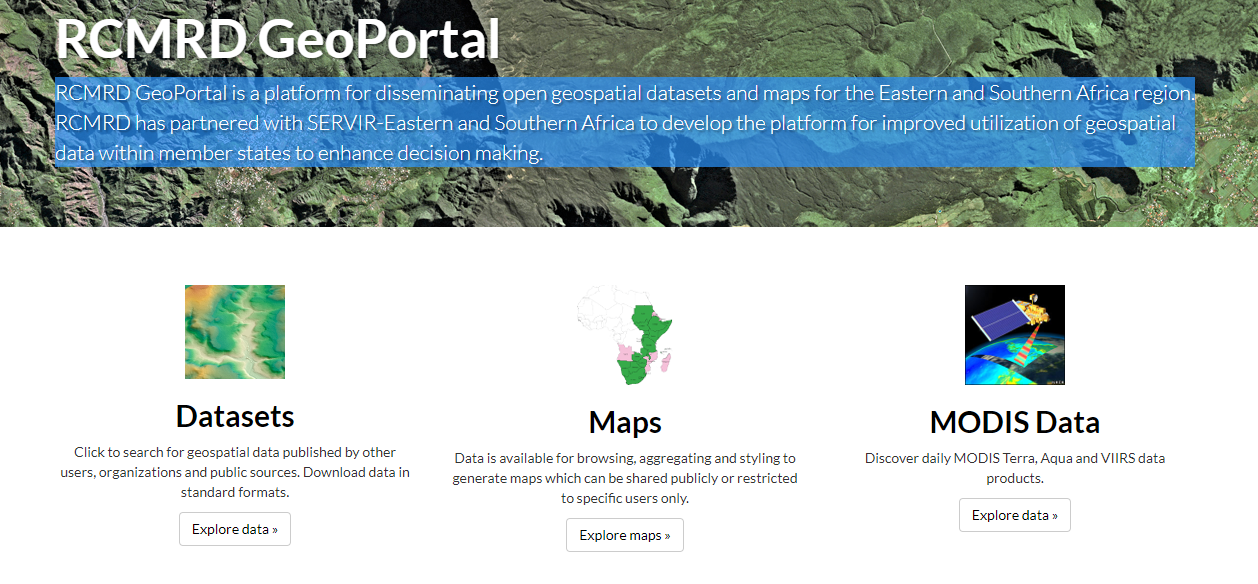 Link: http://geoportal.rcmrd.org/
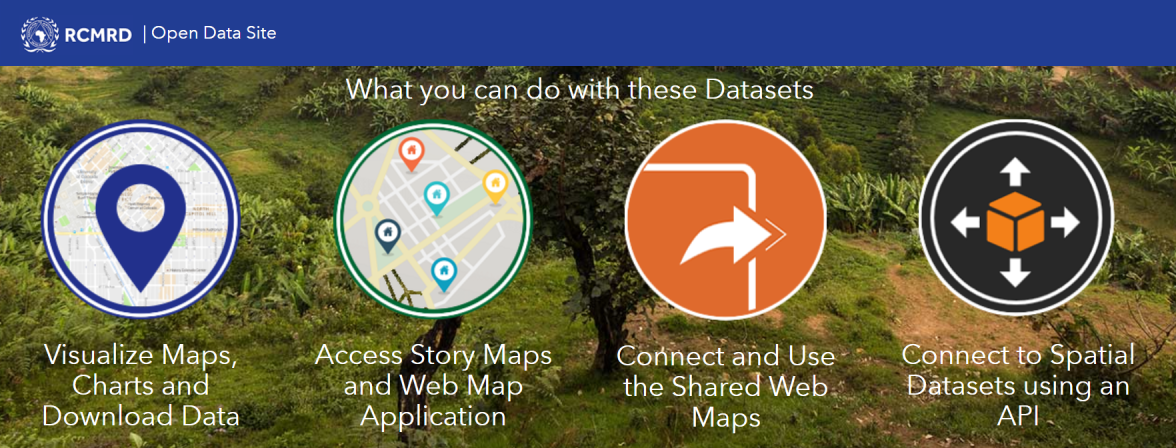
Link: http://opendata.rcmrd.org/
The RCMRD Early Warning Explorer
The RCMRD Early Warning eXplorer (EWX) is a web-based application for exploration of geospatial data related to drought monitoring and famine early warning, customized for application in the African countries. It includes datasets such as rainfall at 5km, maximum temperature, rainfall forecasts and NDVI. The EWX enables scientists, analysts, and policymakers to view diverse data sets side-by-side in the same spatial bounding box, while also stepping through sequences of multiple time-series data sets. The EWX also allows users to view different statistics for user-selected regions by administrative zone, crop zone, hydrologic zones, grazing areas, or country.
Link: http://data.rcmrd.org/ewx-viewer/
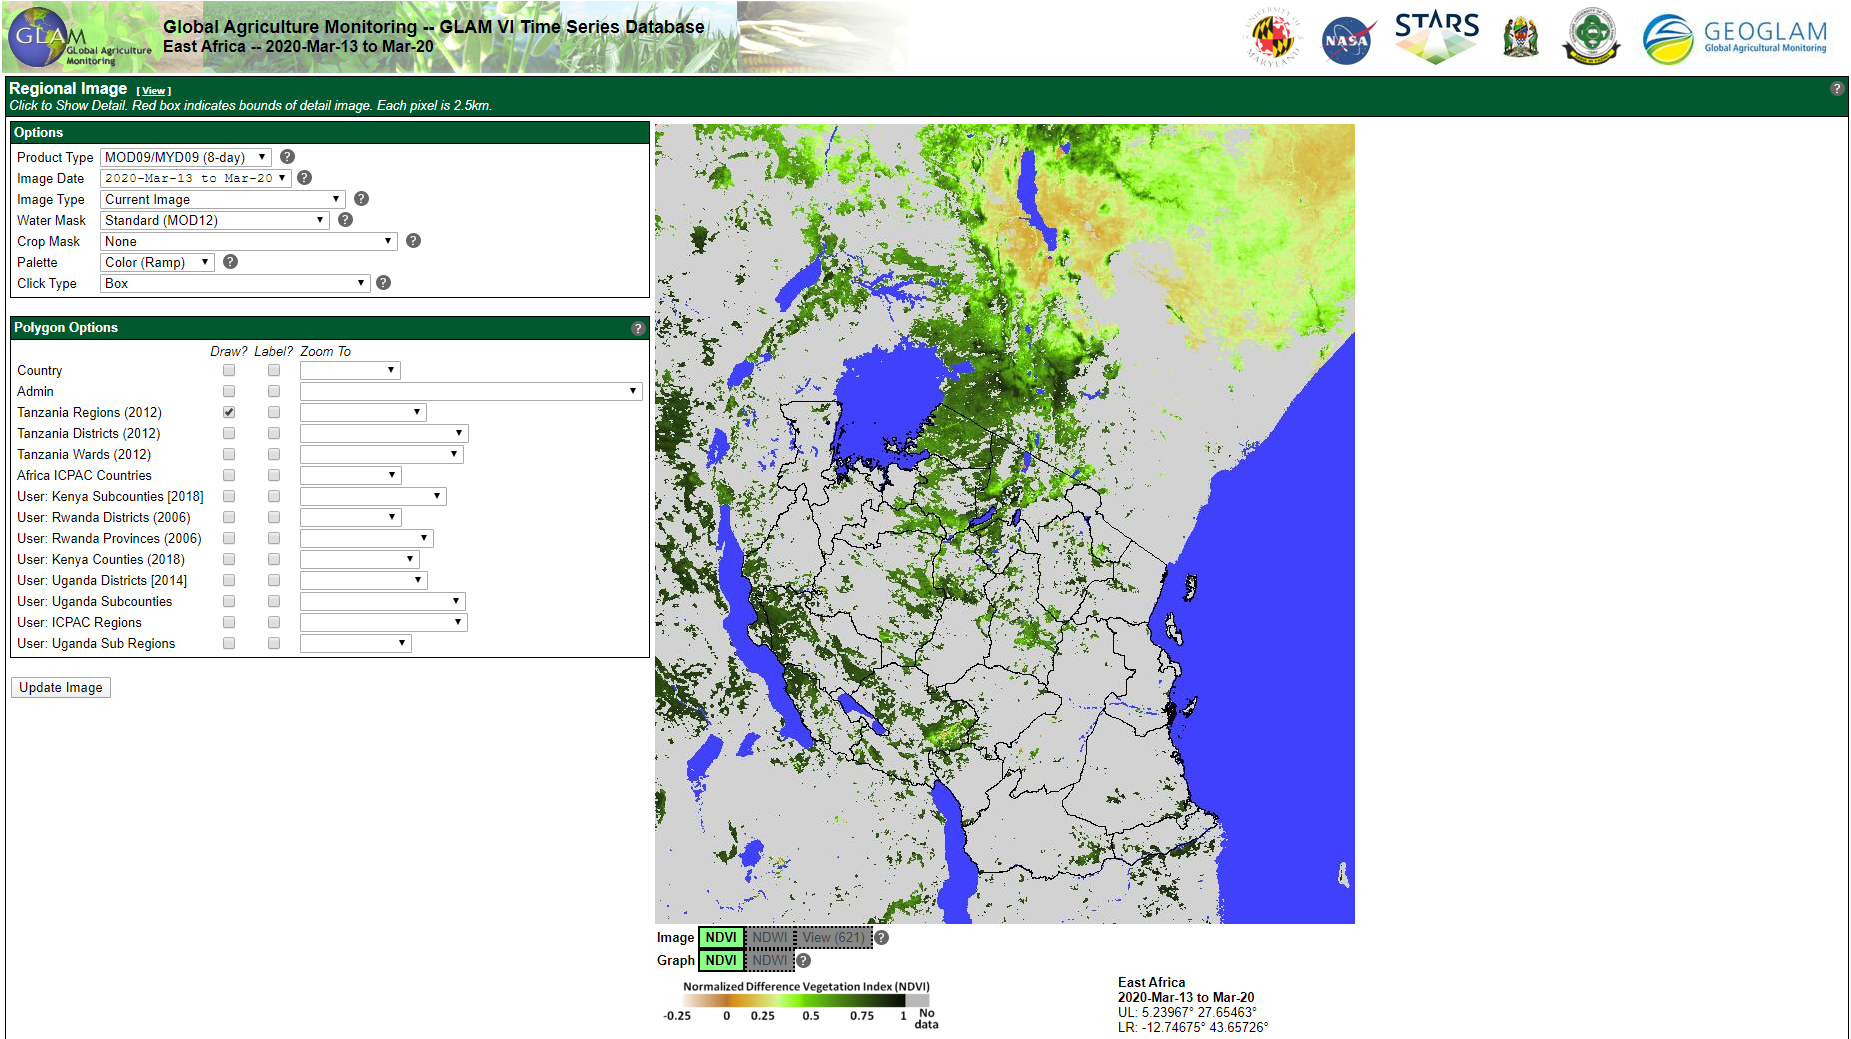
The Global Agricultural Monitoring System
Coverage: Global with regional customizations
RCMRD through SERVIR Eastern and Southern Africa Project has been partnering with the University of Maryland have been building capacity in agricultural monitoring using tools such as the GLAM. The GLAM system is a customized web-based information-analysis and data-delivery system that allows users to monitor crop conditions and to locate and track the factors impairing agricultural productivity. This system provides crop analysts with a suite of MODIS temporal composites of vegetation index data, false color imagery, and a dynamic crop mask. Complementing these data products is a range of web-based analysis tools that allow analysts to interrogate these data and to drill down to the pixel level of detail. Using these data and tools analysts track the evolution of the growing season, make inter-annual comparisons of season dynamics and inform decision makers of agricultural conditions and impediments to worldwide food-security.