Venue: 24 June 2022, 14.00 – 15:30 CEST
30 years ago, large scale market uptake of precision farming was ‘put on ice’ due to the aged farming population. The same is attempted in 2022 – yet in the meantime there has been a generational change on the farms:
- is it really that farmers are and forever shall remain stuck at the unfortunate end of the digital divide
- or could it be that we, the technologists and scientists have failed in building solutions that are practically viable?
During the Webinar we will try to present our vision of new advisory services, based on asymmetric communication and collaborative sharing data between advisor and farmer. We will explain what MapWhiteBoard is, how it can be modified for SmartAgriculture and how to run such communication between advisor and farmer.. Part will be practical demonstration.
Agenda:
- Introduction and link to previous Webinars (Marketa Kollerova as a moderator)
- From data to knowledge – our vision of future advisory services for farmers – Karel Charvat (15 minutes)
- What is MapWhiteBoard – Raitis Berzins (10 minutes)
- Integration of data in Map composition – Franta Zadrazil (5 minutes)
- Principle of asynchronous services and potential solutions – Runar Bergheim (15 minutes)
- Live demonstration with existing tools and MapWhiteBoard – Herman Snevajs, Pavel Gnip
- Discussion and future steps – Karel Charvat
- Closing of spring series of AgriHub webinars (Marketa Kollerova)
Registration for the webinar is FREE. Register yourself via this link.
Who do you want to inform or engage?
People providing advisory services or developing technology for farmers. researchers, who introduced new solutions.
Read more about addressed topic:
Precision farming came to prominence as a scientific concept in the 1990s on the strength of technological advances that enabled variable rate application of irrigation, fertiliser, and pesticides. The practical benefits were demonstrated and well-proved. However, the uptake among farmers was slow and the domain has evolved on the fringes of mainstream agriculture up to and including the present day Initially, change resistance among an ageing rural farming community was blamed for the slow adoption, but 25 years later, a generation change has taken place in the custodianship of agricultural lands. When the adoption of precision farming practices still remains very limited, it is likely that the problem lies in the communication of, accessibility to and delivery of precision agriculture technology from the scientific community, industrial actors, SMEs and farmers. The combination of Earth Observation technologies, GNSS—one of the key technologies for precision farming—and precision farming itself is discussed as one of the “killer applications” for space technologies.
We have a number of state-of-the-art technical platforms that are capable of harnessing EO and remote sensing data from a plethora, data from machinery and also other data from different sources for agricultural decision making on a very detailed level. The problem is, how to bring these services to farmers.
But, in its eagerness to provide a sophisticated tool, we have overlooked that they do not have skills necessary for all these tools and do not possess a supercomputer and would be using this tool at the very maximum few times in a year. Thus, utilization of technologies depends on man-in-the-middle services provided by regional and local agricultural advisors who will use the platform on a regular basis as they each serve a multitude of farmers and agricultural businesses. We have a high skills consultant, who will use these tools. Service organizations will conduct high resolution spatial analysis for their client farms – but when the analysis is done, they are required to discuss the results and how to apply them to the specific farm together with the farmer.
Then, the goal of this project is to develop an application, helping a farmer and other players in the agri-food value chain to make proper decisions leading to sustainable production and reducing the losses and energy and chemical production based on evidence decision making.
The evidence comes from data, turned into information. The information then needs to be presented in a clear way, to help understanding of a studied system (knowledge) and objective reasoning (wisdom).

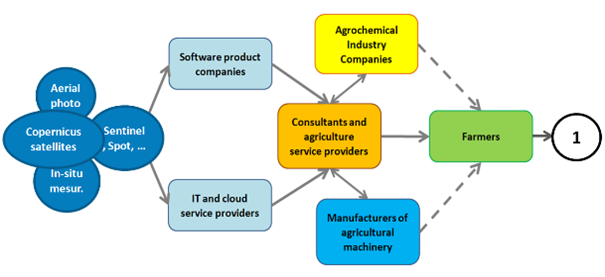
Users of data in agriculture, a part of the precision farming, can be divided into two groups as:
- data processors – service IT providers, software producers and consultants, and service organizations in the domains including Earth observation, aerial photogrammetry, drone application, phytopathology, agronomy, interpretation of vegetation data from satellite and aerial images, etc.
- consumers of results produced by data processors – farmers, engineering and environmental agricultural companies, agronomists, machinery manufacturers and input providers (fertilizers, chemicals).
Members in both of these groups must collaborate in order to develop all required applications. Then all will benefit from these applications: farmers can make informed decisions regarding their crops and advisors can sell services to farmers and input providers can use weather and soil maps to predict the demand for fertilizer.
The vision of the Map Whiteboard innovation was born out of a sequence of large-scale collaborative writing efforts using Google Docs. As opposed to traditional offline word processing tools, Google Docs allows multiple people to edit the same document—at the same time—allowing all connected clients to see changes made to the document in real-time by synchronizing all changes between all connected clients via the server. The overall vision for the technology is that a Map Whiteboard will be to GIS what Google Docs is to word processing.
An additional dimension to the Map Whiteboard technology is the importance of sharing rather than only sharing data. Spatial data are subject to (mis)interpretation; maps are the means to express these interpretations in a manner suitable for communicating purpose, intent and shared understanding. The Map Whiteboard is not limited to editing a shared dataset. The technology shares the entire map, presenting the data in the context of any background information that may be useful. It allows multiple clients to see the identical map interface and simultaneously draw on it, emulating the widespread use case of sitting around a meeting table looking at a map together, annotating it, pointing at “things”, and proposing changes.
The MapWhiteboard is tested now as an add-on to an application that performs automatic zoning of agricultural fields based on remote sensing data for defining yield potential and nitrogen application. The application takes as input a field, automatically acquires satellite imagery time series data, calculates indices such as the NVDI and uses the resulting 4D data to determine zones in the respective field that should be treated differently with respect to fertilisation, irrigation and pesticide application.
The MapWhiteboard component adds value to this scenario in two ways:
- Users can indicate points that reside within distinct areas of the field
- Users can modify the resulting zones after auto-classification
- Users can add recommendations, rates to the individual zones