
This mid-term report of Challenge #3 contains the most interesting and valuable achievements, which have been done so far.
- There are 19 registered participants in our challenge.
- A collaboration with challenges has been established or being negotiated:
- CHALLENGE #8 Digitalization of indigenous knowledge in African agriculture for fostering food security – through the incorporation into the African community around such a challenge,
- CHALLENGE #13 Calculation of agro-climatic factors – potential source of information for forecasting regional food supplies – through the visualization and map sharing of calculated agro-climatic factors (ongoing),
- CHALLENGE #4 Rural Attractiveness Visualization – through the sharing of maps created in this challenge (negotiated).
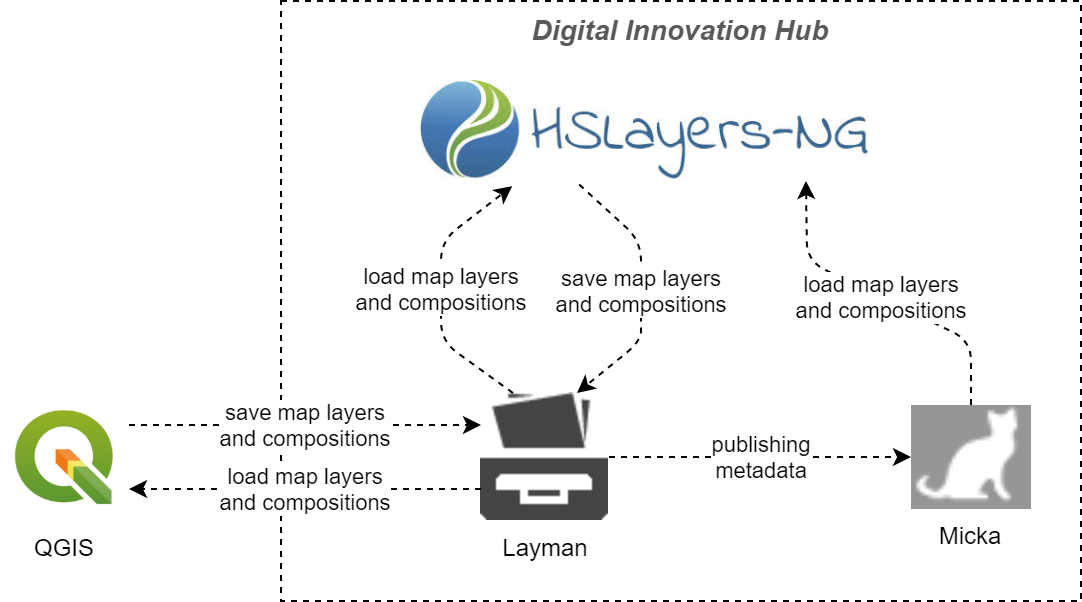
- Our intention is based on map data sharing using three main open source components (see the figure below representing a schema of map data publishing):
- Layer Manager (Layman) QGIS Plugin
- HSLayers-NG
- Digital Innovation Hub (particularly SmartAfriHub)
Thanks to the intensive use of the mentioned components, there is a rapid development of them, fixing bugs appeared, enhancing user experience and spreading information about such tools for map data publishing among users.
-
- Solved issues regarding authentication of QGIS plugin
- Layman plugin installer updated to be more intuitive
- Plugin refactored to request Layman asynchronously
- Czech localization added to the plugin
- Resolved sharing from HSLayers client to social networks
- HSLayers Layman errors notifications made more user friendly
- Fixed bugs and adapted GUI of HSLayers drawing tool based on user feedback
- Another minor bug fixes
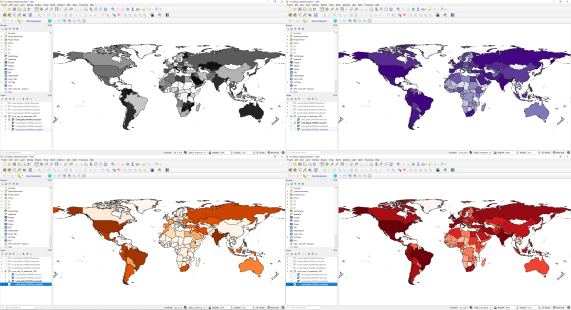
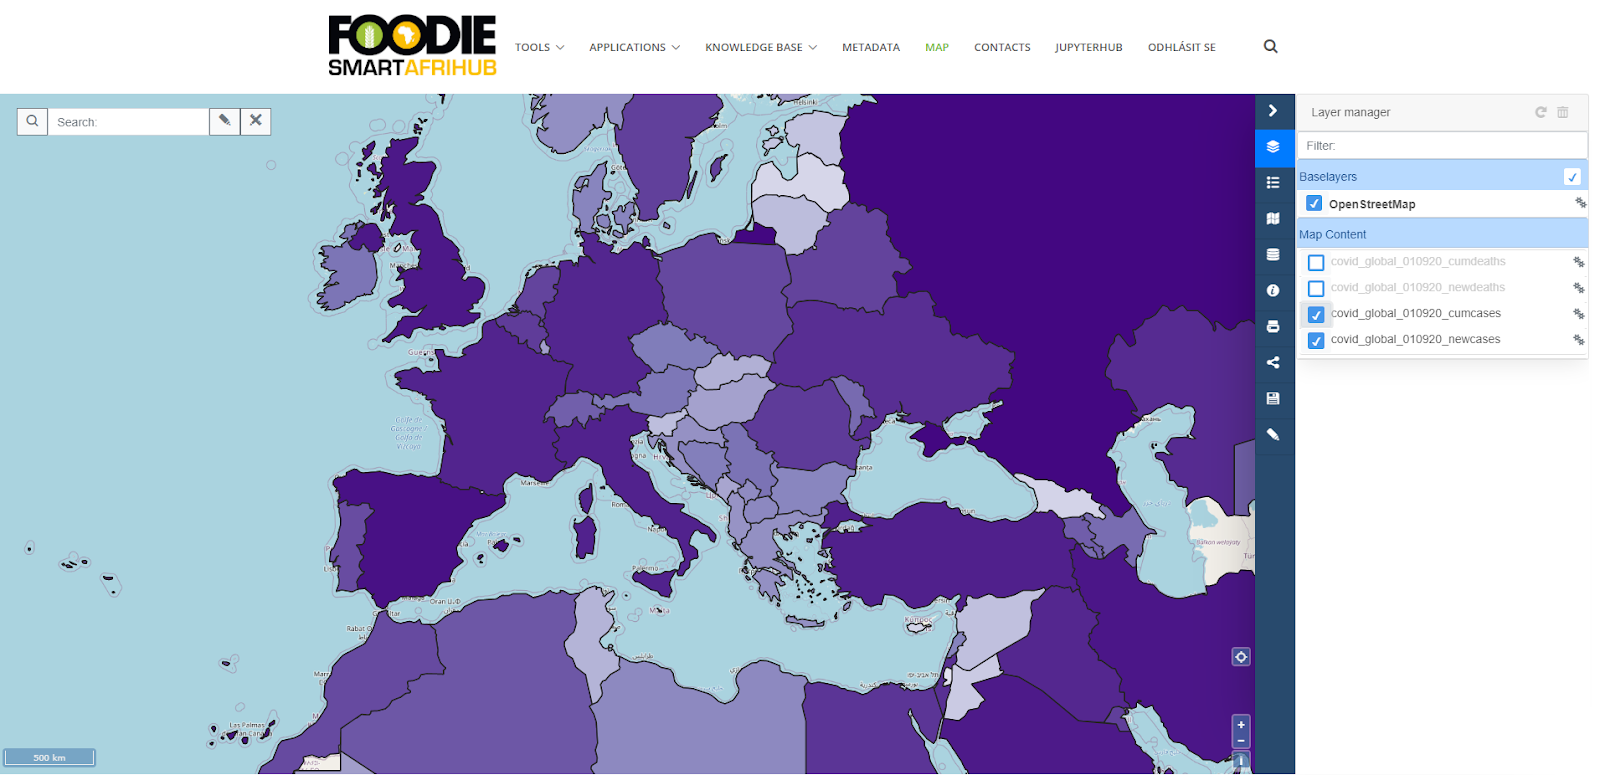
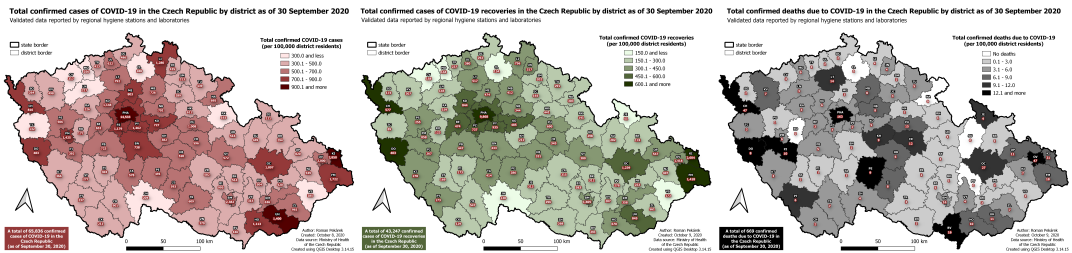
- Creation of Covid-19 related maps and map compositions. See the examples below:
- Map composition of Covid-19 cases and deaths (new and cumulative) on 1st October 2020 worldwide displayed in QGIS SW
- Map composition of Covid-19 cumulative cases from the previous example displayed in the HSLayers web client, i.e. map composition is stored on a HUB and visualized using a web browser
- Map composition on Covid-19 weekly cases/cured/deceased in the Czech Republic from 30th September (ongoing work)
- Components for metadata harvesting have been set up in Micka catalogue and tested (https://www.agrihub.cz/micka/). Map compositions and data layers had been harvested from the Czech National GeoPortal (https://geoportal.gov.cz/)
- A webinar covering Challenge 3 topics was broadcasted on the 1st of October, the webinar’s recording is available here: https://event.webinarjam.com/replay/59/nkpy0i5pumzcvyur50
- Step-by-step video sequences on how to use Layman QGIS plugin (available here: https://youtu.be/8Z1Gube6nuc) for map compositions and how to use HSLayers-NG for online creation and visualization of map compositions (available here: https://youtu.be/JFAhBCYPaSU) were shooted
- Future plans:
- Further development of the mentioned involved tools
- Further incorporation of users in development of the tools
- Spreading the information about our tools and our open source-based approach
- Sharing more maps and information helping to established Citizens Science Network for Peer to Peer Maps Sharing
- Fulfill cooperation with other challenges of Covid-19 INSPIRE Hackathon