Challenge #6: Mid-term Report

Let’s read the mid-term report of challenge #6 Atlas of Best Practices – Polirural cases. 

Mentors

  • Petr Horak is mostly responsible for technical development and coordination within the challenge
  • Pavel Kogut is in charge of stakeholder engagement and day-to-day communication with participant

Registrations

Since 3 Sember 2020 when the challenge was first announced by Plan4All, a total of 20 participants signed up to it. Many of those who registered are partners of the PoliRural project. However, a few people are completely external, and some come from outside the EU e.g. Ethiopia, Rwanda. 

Process

Groups

To better manage participants and improve the overall coordination of the challenge, mentors decided to divide people into three groups: 

  • Atlas Consultants: The purpose of this group is to advise the PoliRural tech team on how best to incorporate frontend and backend changes requested by Collectors and Testers to improve the current version of the Atlas. No programming input is expected from Consultants, however it will help if people joining this group have some UX and web development experience.
  • Case Study Collectors: This group will be primarily responsible for gathering case studies (a template will be provided later) that will eventually appear on the Atlas. Additionally, Collectors will need to provide feedback to Developers on how they would like the case studies to be displayed (frontend) and what admin features they would like to use when accessing the Atlas (backend). Collectors are not required to possess any technical skills. What is important is the ability to collect information using desk research and other techniques, as well as to have some basic writing skills (to present the case studies in English) and of course an overarching interest in rural affairs.
  • Prototype Testers: The role of Testers is to assess Atlas improvements implemented within the scope of the Challenge. A special questionnaire will be created to gather structured feedback from Testers several times during the process. People that collect case studies can also volunteer to test the prototype solutions, so it’s possible to be a member of both groups at the same time. No special knowledge or skills are needed to perform testing activities. What’s needed is an impartial assessment of the tool from a layman’s point of view.Welcome email

Webinar

A joint webinar involving the mentors of Challenge 2, 6 and 12 was held on 20 October 2020 at 09:00 CET. Petr Horak presented the overall Atlas architecture and its background (Enabling project), while Pavel Kogut introduced Challenge 6 to the attendees. In his presentation, Pavel first set the context for the challenge by describing some of the problems that rural areas are facing e.g. poverty and social exclusion, lack of public services, negative population dynamics. This part was followed by a quick overview of pressures caused by the pandemic (e.g. demand shocks, falling tourism, logistics bottlenecks) and their impact on rural livelihoods. Next, several good practices for dealing with Covid-induced rural challenges were presented, drawing on the examples from Europe and the US. The presentation ended with the description of Challenge 6, its objectives, groups, and expectations (next steps). The entire slide deck can be found here.
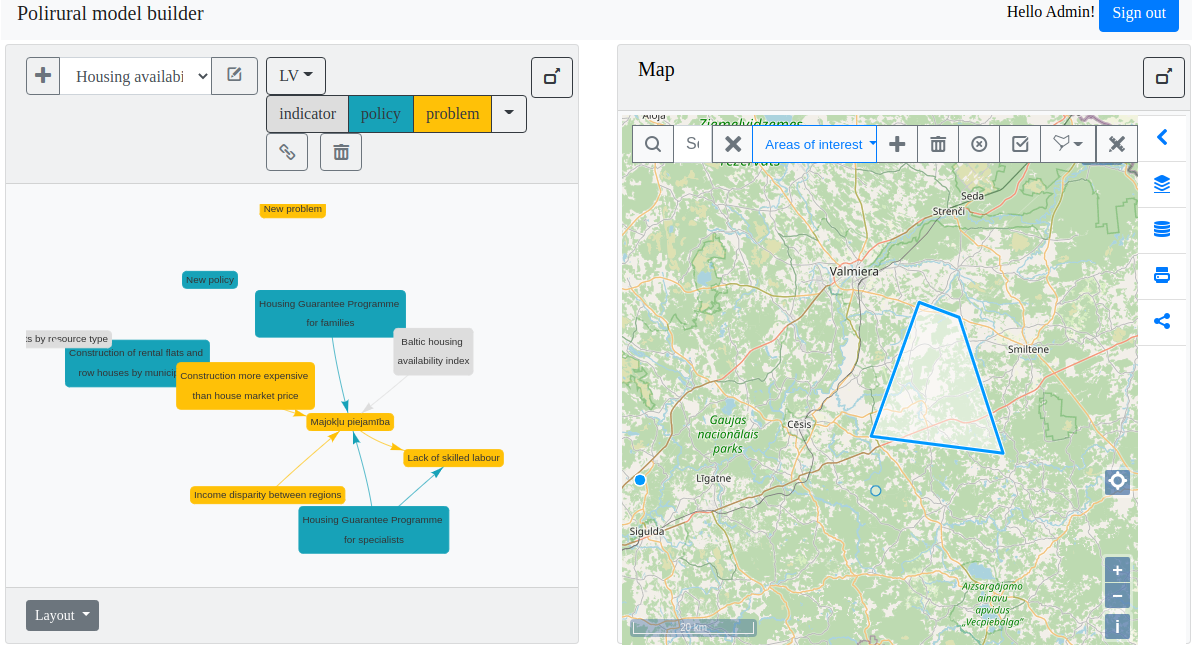
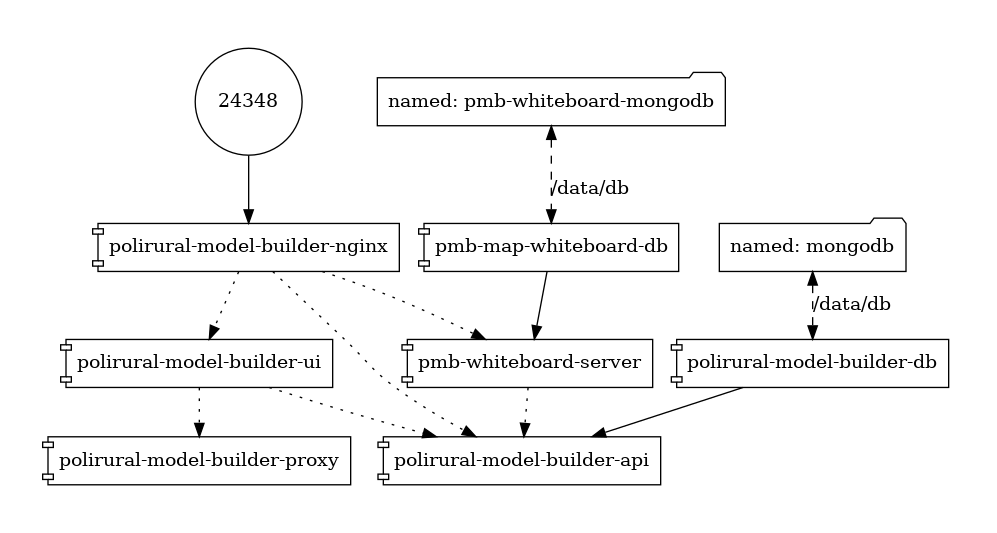
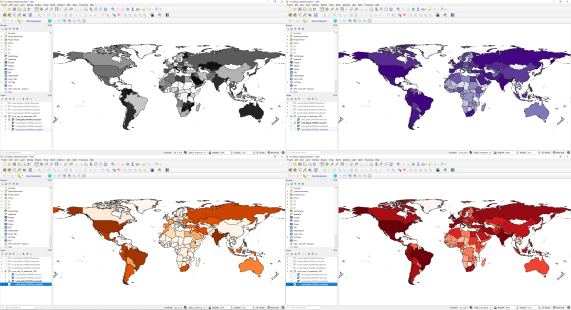
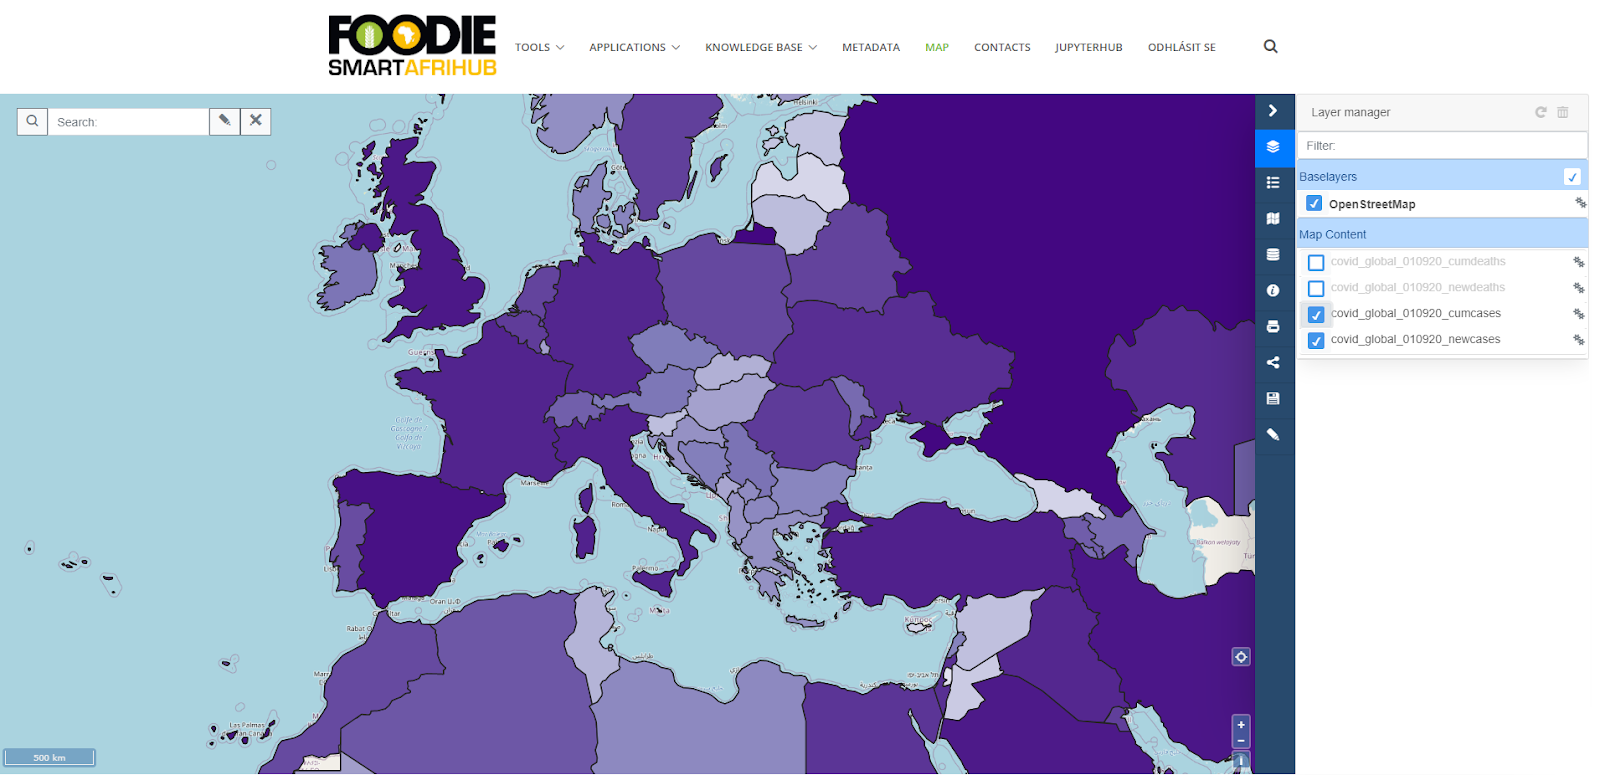
Alpha version 

At the webinar, participants were offered a sneak preview of the Covid Atlas. Currently, it contains two made-up cases that are used only for illustration purposes. In the future, as Collectors supply their case studies to the mentors, the Atlas will be populated with actual stories from across the globe. Eventually, the goal is to integrate the Atlas into the PoliRural Innovation Hub

Case study collection

Shortly after the webinar, Pavel Kogut reached out to interested Collectors and asked them to look for interesting case studies. A template was provided to ensure consistency in data collection, as well as to make further integration with the Atlas easier. First input is expected by early November 2020.

Next steps

Mentors will work on the following in the coming weeks

  • Collating, synthesising and integrating information from Collectors
  • Initiating a series of training sessions with Testers
  • Engaging Consultants with a view to improving the Atlas
  • Capturing feedback for integration in the final report
  • Preparing for the final event

Challenge #13: Mid-term Report

The main goal of the challenge is to calculate agro-climatic factors of a selected area of interest. The second task for this challenge is to analyse inner uncertainty of climatic data provided by the Copernicus ERA5 Land dataset and compare this dataset to the dataset produced by in-situ sensors in pilot localities. 

During the first period of the Challenge No.13 discussion about agro-climatic factors and their selection for forecasting regional food supplies was done. The selected agro-climatic factors are following:

  • frost-free periods, growing degree units, heat stress units, number of (optimal) growing degree days from temperature.
  • nitrogen application window from soil temperature.
  • accumulated solar radiation from incident sunlight.
  • water balance from precipitation, evapotranspiration, and runoff data.

Pilot area of interest was selected and datasets from Copernicus ERA5-Land database was downloaded. The pilot area of interest will be Pilsen region, Czech Republic. For evaluation and comparison of global data versus local in-situ sensors, two small localities were selected. Previous sensor campaigns were organized in these 2 pilot localities. First locality is in southern part of Czech-Moravian Highlands – Kojcice. Second one is in Northern Moravia – Trisce.

We have collected sensor data from locality Kojcice between spring 2016 – winter 2018 from soil sensors and meteostation. We have data from locality Trsice between spring 2015 – autumn 2018 from meteostation. Corresponding phenomena will be collected form the ERA5-Land dataset for both localities. 

First period was mainly oriented on selection of phenomena and factors, selecting area of interest and data collection from global and local perspective.

The team for the Challenge No. 13 consists from 15 members, where mainly EU states are presented, partly Africa and one member from the US. 

Challenge #11: Mid-term Report

Covid19 pandemic and mainly subsequent restrictions was and still is a test for the food supply chain in order to provide enough food to the market to the end customers. Especially in crises a good decision can be made only with enough information.The yield potential is highly prone to the seasonal effects such as drought, floods, optimal amount of rainfall, duration of insolation, temperature and others which can make the predictions highly different from the reality. The goal of challenges is to design methods of monitoring yield and climatic conditions during the season, which can influence negatively or positively yield in the season. 

As the reference layers we use the yield production zones calculated from 2013 – 2019 with the trends during the season of 2018. Temporal trends or events will be analysed on the basis of comparison of yield trends with Sentinel 2 EVI (Enhanced Vegetation Index) Index which is very close to NDVI index. The reason why we have decided to choose EVI index instead of NDVI is that EVI index does not suffer from saturation effect.

Figure 1: Map of yield potential delineated from multi-temporal Landsat imagery

Our aim is to monitor phyto phenology of wheat in Rostenice farm, where we have available data of yield potential, field boundaries geometry and inter alia, the information on the type of crop grown in the field.

Metrics

EVI will be calculated for every image where it is not too cloudy. The difference Δ between EVI values in two consecutive images will be calculated using following formula:


Figure 2: Formula to calculate normalized difference between two EVI layers

where v1 and v2 are EVI values of the same pixel and t1 and t2 stands for time in days.We know from previous experience that the difference cannot be negative. The size of the difference value shows how much had the crop (wheat) changed in reality. This information is very useful for measuring the effect of any issue or condition during the season. Thanks to this difference information we will understand better the individual phases in crop growth.

Another way to compare the EVI values is to calculate integral for the whole season. Mathematical formula to calculate integral (SUM) is depicted below:

Figure 3: Formula to calculate integral for the whole season

where again v1 and v2 are EVI values of the same pixel and t1 and t2 stands for time in days. Thanks to integral value we can see where EVI was mostly above the average and which places were under the average most of the season compared to other places in the image.

Last way to compare EVI values will be by simple statistics within chosen fields. When comparing the mean value of some fields, we will learn which field has higher yield potential. We will also compare deviation in order to validate our metrics.

Challenge #8: Mid-term Report

The figure 1 outlines the challenge #8 concept and selected two pathways. The concept encompasses 4 phases; what indigenous knowledge to collect, how to collect, how to evaluate the quality of the knowledge,  and finally how to record and share the indigenous knowledge.  So far we have decided to put effort on two pathways but we are still looking for additional ideas for pathways. Pathway 1 is addressed on grain storage systems in Africa. Pathway 2 is about mapping out soil microbes coverage, quality and quantity in African continent.


Figure 1: The concept of challenge #8

The team of challenge 8 consists of 31members from 17 countries.  Most of the team members are from Africa continent.  The team uses emails, WhatsApp and Skype for communication. WhatsApp is the most active channel having 13 team members. Skype group has also gathered 13 members.  

By 19.10.2020, there have been 3 team meetings: 1 pcs for general, 1 pcs for pathway 1 and 1 pcs for pathway 2.  The discussion, ideation, knowledge transfer could have been more active and vivid, but we are still in a ramp-up phase of the project.  The first results to come will hopefully and activate participants into dialogue.  

The kick-off webinar was planned to be on week 40, but it was necessary to postpone to 23.10.2020 (week 43) due to one presenter’s personal reason. 

Pathway 1 needs support from the challenge 6 expert Peter Horak,  and Pathway 2 from the challenge 3 expert Pavel Hajek. The co-operation between challenges enriches and enables more ambitious deliverables and increases all participants’ know-how and skills. 

At the moment there are no particular risks ahead.  The next tasks are to ideate additional pathways, pilot the 4-step concept and constantly assess the progress. To enhance team dialogue is one of the core tasks. 

Challenge #7: Mid-term Report

The African agricultural production and marketing faces significant huddles for it to address the needs of the continent and achieve food security in 2030. For ages, the production and supply chains have been heavily fragmented coupled with non -transparent, insufficient and non-communicating business networks which have diminished farmer’s productive capacity and wellbeing. From a food supply and marketing side, selfish minded individuals have capitalized in this space by creating processes and networks that are exploitative. Likewise, processes that deal with production and transactional data between actors and products is rarely integrated let alone shared. As such, the disconnection and lack of transparency and accountability complicates fair pricing and quality of products.

In order to address the above problems, Challenge 7 team intends to develop a blockchain technology and apply same in Africa agriculture in the COVID 19 and post COVID 19 era.

PARTICIPANTS

Challenge currently has 29 registered members and some who are not registered but have identified on the various social media platforms from across different continent of the world.

MEAN OF COMMUNICATION

Challenge 7 created various social media platform (Whatsapp, Email and Skype) where occasionally they meet to have meetings and decide steps to achieve the goal of the team. 

WEBINAR

Challenge 7 hosted a webinar on the 23rd September, 2020 and they were 11 participants who joined the webinar out of about 36 persons that indicated interest.

BLOCKCHAIN TECHNOLOGY

Participants were asked to collate challenges information from their country’s local farmers that will be address in the development of the technology. Participants from Nigeria, Cameroun, Zambia, Uganda and Kenya submitted the challenges faced by their farmers and same was communicated to Jika (Technology developer). The technology is in the development process and will be shared with participants next weeks for familiarity and pilot testing.

WAYFORWARD

The next step for the Challenge 7 is the presentation of the Blockchain technology by Jika for familiarity, testing before the field pilot testing across Africa.

Challenge #5: Mid-term Report

Since the inception of map whiteboard challenge and the first draft release in summer, various improvements have been made to the software parts enabling whiteboard functionality. This document will summarize the developments since that time. The current working prototype of the integrated system runs at https://dih.bosc.lv/modeller/private/ and is available for authorized users. The system’s purpose is to provide the user the possibility to create system dynamics models with linked spatial information in a form of map composition for each graph or model.

Whiteboard library and server configuration

Server architecture

A docker based environment has been setup to run the components in production (see the diagram).

It consists of 2 mongo databases – one for the container application (Polirural modeller) and one for map whiteboard. Similarly we use 2 rest api endpoints named polirural-model-builder-api and pmb-whiteboard-server where the whiteboard-server supports both REST and Websocket protocols. At the top resides an nginx proxy to rule them all. 

The map whiteboard server connects to model-builder-api provided GRAPHQL endpoint to validate user sessions and get the current users info. This is used as an alternative to OAUTH2, but conceptually does the same thing.

Client architecture

On the client side we have an Angular9 based application, which incorporates a map window component based on HSLayers-ng. Since it runs Openlayers under the hood, we can integrate the Map whiteboard library using the underlying Openlayers map object.

Since Hslayers already provides feature drawing functionality we have added to map whiteboard library the possibility to turn off the drawing toolbar not to have duplicate user controls and call the whiteboard libs data synchronization methods directly from javascript using hooks in hslayers. Also switching the current edited layer on mapwhiteboard library from outside needed to be created since the application supports multiple editable vector layers which are done on hslayers side. 

Map composition preparation

The map composition creation is still done in the application outside map whiteboard lib with the help of hslayers-ng, because it supports multiple layer types and parameters. The json serialize map object or individual layer is then passed to map whiteboard client side code, which then sends it to the server. This happens at the moment when the user selects a ‘Model’ in the dropdown list on the top-left corner of the UI. The software then checks if a map composition is linked to the model and creates it in case it doesn’t exist. In case it already exists the composition is being queried from the map whiteboard server, and layers are populated on the map including the features. 

Recently we also developed an initial user rights model to keep track of who can access and edit the compositions.

The uploaded composition is stored on the harddrive, parsed and the title, description and filename of the composition is stored in Mongo database.

Downloading map composition file was developed (currently without embedded features)

Currently functionality for editing the composition supports:

  • Add new layers either drawable vector or wms, arcgis or vector data loaded from external files
  • Listing of editable layers parsed from composition file
  • Requesting features for particular layers. Multiple editable layers are now supported
  • Listing of my uploaded compositions for current user
  • Granting access (owning) rights to the uploader of composition.

Still needs developing:

  • Granting and removing access rights to additional users. Currently all users can see and edit the composition only they don’t appear in the list of compositions he/she owns.
  • Renaming of layers.
  • Deleting of composition (available to owner).
  • Styling of features
  • Activation of scratch layer
  • Serialization of layers and composition on the map-whiteboard side. 

Features

Whenever a user draws a feature, they are propagated to all the clients currently using the same composition meaning they selected the same ‘Model’ in the dropdown. Features are now linked to particular composition and layer, where previously we had a single fixed editable layer per composition. The features are stored in mongo databases  and modification of them is done through CRUD operations on the Websockets API.

Listing of features is done for a specific editable layer by its title through REST API.

Challenge #4: Mid-term Report

The report summarizes the outputs achieved in Challenge #4 of the COVID-19 INSPIRE Hackathon during the first part of the event.

  • Number of registered participants: 28
  • Challenge #1 Shared Workspace (complete information about activities in the challenge)
  • Interconnection with pilot activities of Polirural project → 15 of the registered participants are involved in Polirural pilots and represent 8 of the 12 pilot regions

  • Webinar – October 12, invitation post, presentation, 27 live attendees
  • Development of testing scenarios 
  • Clustering – testing various clustering methods, imputation of missing data and combination of non-hierarchical and hierarchical clustering

Challenge #3: Mid-term Report

This mid-term report of Challenge #3 contains the most interesting and valuable achievements, which have been done so far.

  • There are 19 registered participants in our challenge.
  • A collaboration with challenges has been established or being negotiated:
  • CHALLENGE #8 Digitalization of indigenous knowledge in African agriculture for fostering food security – through the incorporation into the African community around such a challenge, 
  • CHALLENGE #13 Calculation of agro-climatic factors – potential source of information for forecasting regional food supplies – through the visualization and map sharing of calculated agro-climatic factors (ongoing),
  • CHALLENGE #4 Rural Attractiveness Visualization – through the sharing of maps created in this challenge (negotiated).
  • Our intention is based on map data sharing using three main open source components (see the figure below representing a schema of map data publishing):
    • Layer Manager (Layman) QGIS Plugin
    • HSLayers-NG
    • Digital Innovation Hub (particularly SmartAfriHub)

Thanks to the intensive use of the mentioned components, there is a rapid development of them, fixing bugs appeared, enhancing user experience and spreading information about such tools for map data publishing among users.

    • Solved issues regarding authentication of QGIS plugin
    • Layman plugin installer updated to be more intuitive
    • Plugin refactored to request Layman asynchronously
    • Czech localization added to the plugin
    • Resolved sharing from HSLayers client to social networks
    • HSLayers Layman errors notifications made more user friendly
    • Fixed bugs and adapted GUI of HSLayers drawing tool based on user feedback
    • Another minor bug fixes
  • Creation of Covid-19 related maps and map compositions. See the examples below:
    • Map composition of Covid-19 cases and deaths (new and cumulative) on 1st October 2020 worldwide displayed in QGIS SW

  • Map composition of Covid-19 cumulative cases from the previous example displayed in the HSLayers web client, i.e. map composition is stored on a HUB and visualized using a web browser

  • Map composition on Covid-19 weekly cases/cured/deceased in the Czech Republic from 30th September (ongoing work)

  • Components for metadata harvesting have been set up in Micka catalogue and tested (https://www.agrihub.cz/micka/). Map compositions and data layers had been harvested from the Czech National GeoPortal (https://geoportal.gov.cz/)
  • A webinar covering Challenge 3 topics was broadcasted on the 1st of October, the webinar’s recording is available here: https://event.webinarjam.com/replay/59/nkpy0i5pumzcvyur50 
  • Step-by-step video sequences on how to use Layman QGIS plugin (available here: https://youtu.be/8Z1Gube6nuc) for map compositions and how to use HSLayers-NG for online creation and visualization of map compositions (available here: https://youtu.be/JFAhBCYPaSU) were shooted
  • Future plans:
    • Further development of the mentioned involved tools
    • Further incorporation of users in development of the tools
    • Spreading the information about our tools and our open source-based approach
    • Sharing more maps and information helping to established Citizens Science Network for Peer to Peer Maps Sharing
    • Fulfill cooperation with other challenges of Covid-19 INSPIRE Hackathon

Challenge #2: Mid-term Report

The report summarizes the outputs achieved in Challenge #2 of the COVID-19 INSPIRE Hackathon during the first part of the event.

  • Number of registered participants: 11
  • Challenge # 2 Shared Worskpace 
  • The final goals of the challenge:
    • Main goal:
      • To develop the advanced and much more practical version of Atlas of Regional Specialities and the e-shop and to think out the proper way to intertwine it finally and usefully to successfully promote both but especially the region itself.
      • The challenge aims to eliminate the above-mentioned problem situations by supporting regional primary producers and primary food processors (farmers, fruit and vegetable growers, butchers, etc.), collecting information about their products and making this information and products available to end customers.
    • Secondary goals
      • To present midterm results in the events organized in the hackathon.
      • To create an active group of co-workers (developers, testers, data providers, feedback providers, etc.).
      • To implement a special set of functionalities for further innovation of the Atlas.
      • To prepare a space for possible future steps on replication of such Atlas also for further regions with a special and similar local-regional specialities. 
      • To figure out and arrange the sustainability of the solution.
      • To promote the H2020 project LIVERUR and vice versa as the background for the e-commerce side of the Atlas being developed in cooperation between 2 Czech partners (one technical, second one pilot): WRLS and UHLAVA. 
  • Brainstorming session on Jamboard during the webinar (20/10/2020) via QR code:

Background:

Problem situations related to Covid-19, such as restrictions or temporary interruptions of work, quarantine, restrictions on the number of people in stores or restrictions on sales time, can lead to a change in shopping habits. The result can be an oversupply of households leading to unequal distribution, a temporary shortage of certain foods, and rising prices.

The challenge proposal aims to eliminate the above-mentioned problem situations by supporting regional primary producers and primary food processors (farmers, fruit and vegetable growers, butchers, etc.), collecting information about their products and making this information and products available to end customers.

Conception:

One of the possible solutions is to connect regional information about farmers and their available products with various platforms for trading in these products (stone shop, e-shop, purchase from the yard). The Atlas of the Best Practices will be used as the basic technological platform, on the basis of which a pilot prototype of the Atlas of Regional Specialties will be created.

Atlas of Regional Specialities


Challenge #1: Mid-term Report

The report summarizes the outputs achieved in Challenge #1 of the COVID-19 INSPIRE Hackathon during the first part of the event.

  • Challenge #1 Shared Workspace (complete information about activities in the challenge)
  • The final goals of the challenge:
    • Main goal:
      • To develop the advanced catalogue of educational materials (best practices, educational documents, application, services, other resources…) suitable for remote teaching/learning in the EBAG domain.
    • Secondary goals
      • To present results in the events organized in the hackathon.
      • To create an active group of co-workers (developers, testers, data providers, feedback providers, etc.).
      • To implement advanced techniques (such as searching similarities through clusters, links to controlled vocabularies, etc.) to enrich the catalogue.
      • To interconnected with contemporary trends such as Responsible Research and Innovation, FAIR data (findability, accessibility, interoperability, and reusability), Linked Open Data or international standards.
      • To figure out and arrange the sustainability of the solution.
  • Brainstorming session on Jamboard

  • Catalogue for EBAG Education

    • Table with data – the current version contains 65 items from 3 providers (Czechia, Tunisia)
    • The data model of the catalogue based on Dublin Core and other standards, respecting Linked Open Data approach and Responsible Research and Innovation principles

Initial attempts with categorized data (metadata) clustering for searching homogeneities and similarities