
FINAL REPORT ON CHALLENGE #2: Analytical tools for WhiteBoard
Name of mentor(s):Runar Bergheim
Number of participants:5
FINAL REPORT ON CHALLENGE 2 [PDF, 3,3MB]
INTRODUCTION
With an increasing trend towards data-based decision making both on governmental and operational levels, the ability to effectively communicate through maps is increasingly important.
Those applications that come out of two camps:
- Those that lend heavily from professional GIS software and tries to replicate pro-GIS features onto the Web
- Those that stem out of slippy maps APIs where it might perhaps be apt to give a shoutout to Google as a pioneer while the field has later become somewhat more generously populated
A map whiteboard is not a patented term and doesn’t instinctively mean anything beyond a set of associations that may vary from person to person.
We use the term to denote a peer-to-peer technology concept that allows map interactions and modifications to be propagated from one connected web client to all other connected web clients looking at the same map in near real-time.
- When someone moves their cursor, I can see it on my
- When someone draws a feature, I can see it on my screen
- I can edit the features they’ve drawn
- They can edit mine
- We can add layers to maps – and they’ll show up with all of us
During the hackathon we have improved on the MapWhiteboard solution which has its roots in the idea developed in 2016, but later in 2020 which was rewritten using a completely new technology stack. Recently it has been integrated into administrative interface – called map whiteboard-admin. The MapWhiteboard (MWB) technologies are separated into 3 pieces –
- map whiteboard library which wraps SocketIO and OpenLayers into a real time communication enabling solution
- Mwb server which is a Node based software running on server as the name suggests and distributes the messages between the It also provides
multiple authentication methods, queueing and transaction support and conflict resolution.
- MWB admin which runs on the lates Angular framework and provides the UI and workflows integrating MWB
The solution is online and running at https://mapwhiteboard.net/ (landing page developed during the hackathon) and https://mapwhiteboard.net/admin (The administrative side for collaborative maps).
The code repositories are available at https://gitlab.com/plan4all per request on collaboration.
METHODOLOGY
Thematic strands
During the planning phase of the hackathon the following three scenarios outlining ways forward for the Map Whiteboard technology were brainstormed
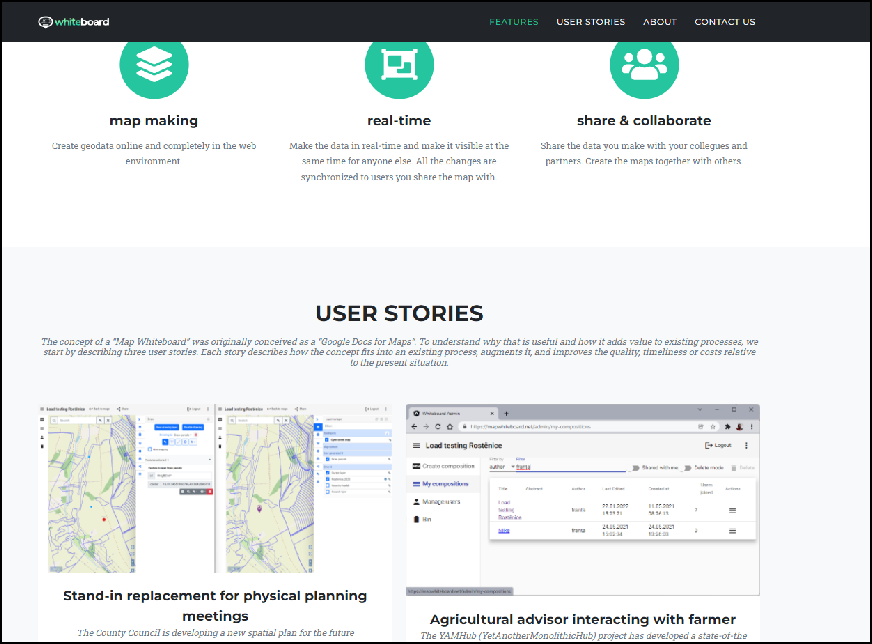
Collaborative analysis for smart farming
The MapWhiteboard is used as an add-on to an application that performs automatic zoning of agricultural fields based on remote sensing data. The application takes as input a field, automatically acquires satellite imagery time series data, calculates indices such as the NVDI and uses the resulting 4D data to determine zones in the respective field that should be treated differently with respect to fertilization, irrigation and pesticide application.
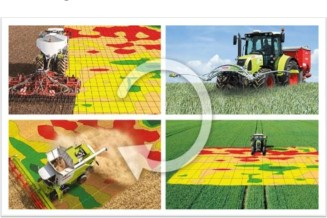
The MapWhiteboard component adds value to this scenario in two ways:
- Users can indicate points that reside within distinct areas of the field
- Users can modify the resulting zones after auto-classification
- Users can add recommendations, rates to the individual zones
Initiatives: DEMETER (Lesprojekt, AV) + Polirural (BOSC T3.x + visualisations + Hub)
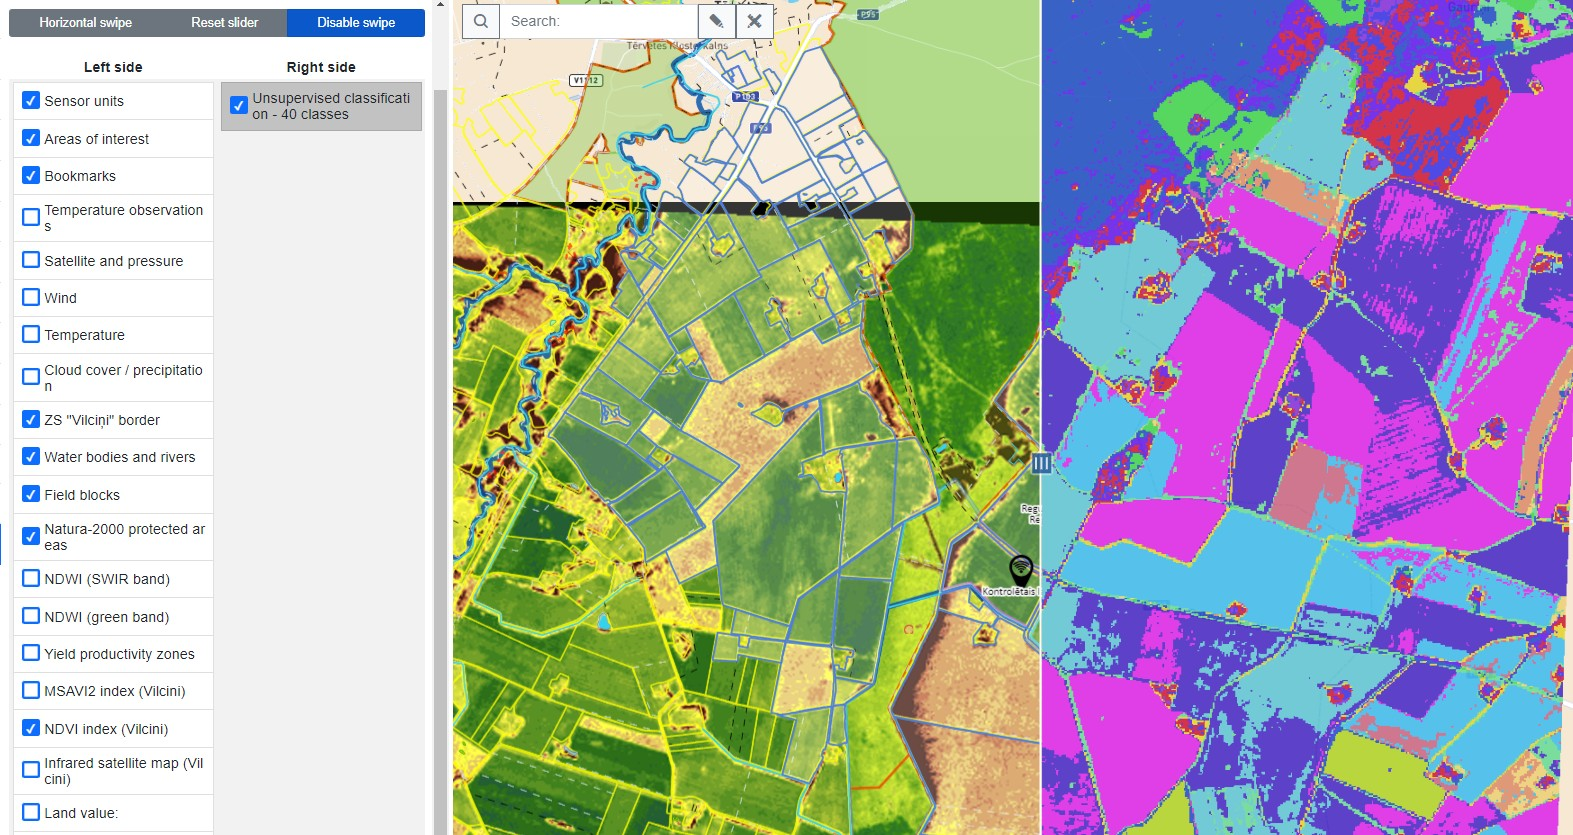
System for visualizing sensor readings and dynamically generating interpolated maps can be integrated into mapWhiteboard in nearest future. Currently the technology for that is developed for HsLayers based apps, but hasn’t been packaged for integration into MWB (see image).
Integrated planning tool
The Map Whiteboard is used as a component supporting collaborative planning processes that involve regional sector authorities, local authorities/municipalities and stakeholders in the planning processes from business/industry/real-estate and NGOs/civil society/organisations.
The traditional planning process requires these stakeholders to work together either separately or, traditionally, in meetings. Much of the interaction concerns maps where people with varying experience in interpreting maps
and spatial data work together in meeting rooms on big screens or hunched above printed maps laid out on a table.
The MapWhiteboard augments the meeting experience, allows people to see exactly what is referred to and can add contextual information to better understand exact locations. A person inexperienced in GIS concepts can see the map as if it was Google Maps, can switch to satellite/aerial imagery background and make simple annotations. A more technical user may add WMS services and other contextual information as well as style vector layers where style is serialized into SLD format and distributed to all participants. All can see each other’s pointers.
Initiatives AV: internal technical platform project Generic meeting augmentation tool
Inspired by tools like menti.com which provides polling functions to ensure participative conferences and miro.com which offers a comprehensive digital whiteboard functionality, the MapWhiteboard is in this case used to bring up a map of anywhere on the globe and allow users to cooperate on the surface by drawing and annotating.
After the meeting is ended, the annotations must be saveable, archived for future reference or for export into GIS tools or other visualization solutions.
Technical strand
Enhancements to Map Whiteboard based technology were identified. Some were completed.
- API documentation for both WebSockets and REST API
- Generic authentication options
- OAuth
- BasicHttpAuth
- TokenAuth/JWT
- Stability
- Error tolerance
- Reconnect on disconnect
- Race conditions between edits
- Generic plugin for OpenLayers based applications
- Decouple, loosen the demo application from the client-side library and server API
- Packaging of server application
- Installation instructions Windows, Linux
- Deployment
- Tablet support
Social auth and other authentication methods
During the hackathon additional authentication methods were integrated into MWB – namely Facebook and Google. The SDK for google authentication ius currently in flux thus might need to be disabled for the time being.
MWB server now supports two distinct methods to manage session data – the conventional (old) mechanism where SessionID is passed with each request either through cookie or as a GET parameter and session data is then read from database. The other method is JWT (Json web tokens) storing the encrypted session data on client side thus enabling much better scalability at the cost of slightly increased overhead since the the whole session contents need to be passed with each request. Its up to the user/programmer consumer to choose.
For simple automation tasks or system integration when the overhead of storing session data would be too large we provide also basic auth option where credentials are sent per each request to the server.
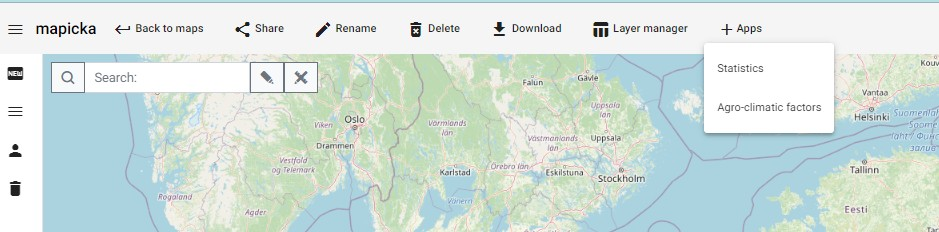
Module federation and micro-frontends
The thematic strands might diverge into many directions and leading to feature creep in the future. To remedy this we have explored an approach of combining features by topic and enabling them on demand. Users of many other platforms are familiar with this concept and may call it “apps” or “widgets” (See image how to enable them).
This is provided into the admin interface and is out of scope of the minimalistic MapWhiteboard library. The technology called micro-frontends enabling it has been developed only recently for Angular 11 and newer based systems.
FINDINGS & CONCLUSION
- The work on mapWhiteboard continues and the tool is taking shape
- Various improvements have been made on authentication and robustness fronts
- New use cases have been identified and work on the vision building has resulted in new project proposals
- Approaches on extendability such as apps and widgets for separate
on-demand features have been carried out and viability proved with 2 apps – spatial statistics visualization app and agro-climatic factor exploration tool previously developed as a standalone tool in other project.
- We are looking for users with real-world problems where MWB might be the solution