
Plan4all has finalised a web map application for the City of Pilsen visualising the expected road traffic situation in Pilsen in one hour intervals during the period from May 2017 to November 2018.
The app is available at https://intenzitadopravy.plzen.eu/.
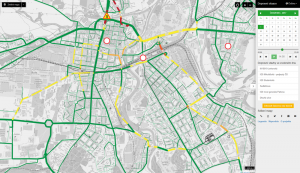 The traffic volume information is derived from the city’s traffic model (which is an advanced prediction and thus might be different from the real traffic situation) and takes into account ongoing roadworks on the selected day. The information about the roadworks is updated quarterly in order to reflect any possible changes of the roadworks. The application includes a timeline presenting the duration of the roadworks and thus providing an easy overview of the main road constructions and closures in the city in the coming years.
The traffic volume calculation methodology
The application predicts the traffic volumes on a selected day and hour based on the traffic model of the city and ongoing roadworks at that time. The calculated traffic volumes are calibrated by street measurements.
The traffic model is based on a matrix that calculates the number of vehicles traveling between every two of approx. 180 ‘traffic generators’ located in the city e.g.: urban zones, office districts, shopping malls, industrial zones, university campus, schools etc. The roadworks on the selected date are taken into account in the calculation as well. After the matrix calculation the counts of vehicles between all the traffic generators are portrayed on the road network, while the ideal (fastest) route together with the capacity of streets and crossroads are taken into account. The resulting traffic volumes are subsequently calibrated by the street measurements of vehicle counts at selected locations. In order to display the traffic volumes in the dynamic web application, the colour scheme of five colours (from green to red) is used to represent the traffic volume, matching the five traffic volume levels used by police. The figures displayed on the road segments represent the expected amount of vehicles on the street per hour.
The web application consumes the data in the form of the Web Map Service supporting temporal data (see the OGC specification, annex D). The web service is available for further reuse within the OpenTransportMap project and on the opendata.plzen.eu portal.